March started much as February had ended, the first couple of weeks I was extremely busy at work and in addition I was in the happy position of having two exhibitions to prepare for in Istanbul: one at the Kasa Gallery, Body of Evidence and No Detectable Level at the online space the Museum of Contemporary Cuts. I must thank the curatorial teams involved in selecting, organising and conceptualising these shows, they worked extremely hard and came up with some great solutions at incredibly short notice. Take a bow Lanfranco Aceti, Vince Dziekan, Ozden Sahin and Jonathan Munro.
I promised myself I would try to be more creative this month and I managed to do some drawings documenting my chemo. Images from the shows and the drawings can be seen here. I also managed to write a submit a paper. I suspect some of the energy to do this work is derived from steroids. More of which later. I also had an MRI scan at Mount Vernon to check the progress of the lesions that they had initially spotted before xmas.
My monthly specialist meeting at UCLH proved interesting. As you are looked after by a ‘multidisciplinary team’ you’re never quite sure who you are going to see and you tend to get different kinds of information from different specialists. Anyhow, I am officially an ‘interesting case’ because of the lack of markers in my testing. This is not necessarily a bad thing, in fact it might be a good thing, as my prognosis might be slightly better. I also found out that I would definitely be having at least one, if not two more cycles of chemo. This pushes the stem cell transplant back to around May time. I took the news stoically.
In terms of side-effects things trundled along pretty much as before, initially anyhow. Some tiredness, the occasional bout of mild nausea. I have whacked on a load of weight though and this is due to the steroid Dexamethasone which I have to take in huge amounts (40mg x 4 days) as a pulse. Dex, ah dex. It can give you an incredible energy boost and make you feel like you can tackle anything. However once the effects wear off you can get quite a rebound which is what happened at the beginning of my third cycle of chemo. I had a real dip, a horrible dip. Utterly miserable and quite a jolt. I have decided to be more careful about what I eat, my meditation practice will have to start again too. I let it slip.
On to the numbers.
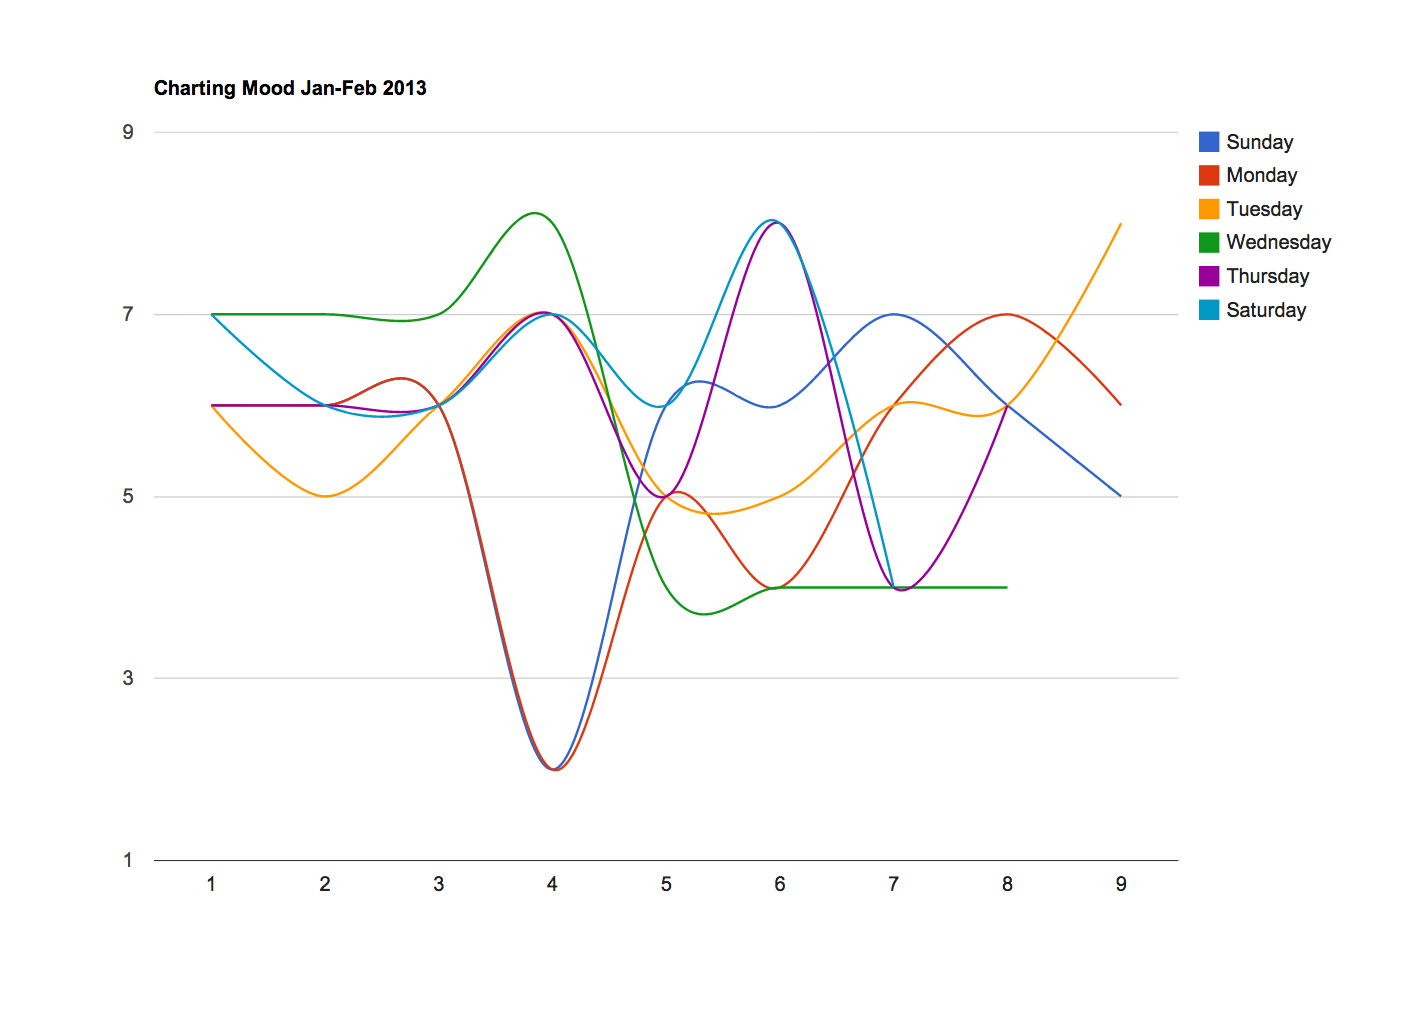
Affect analysis
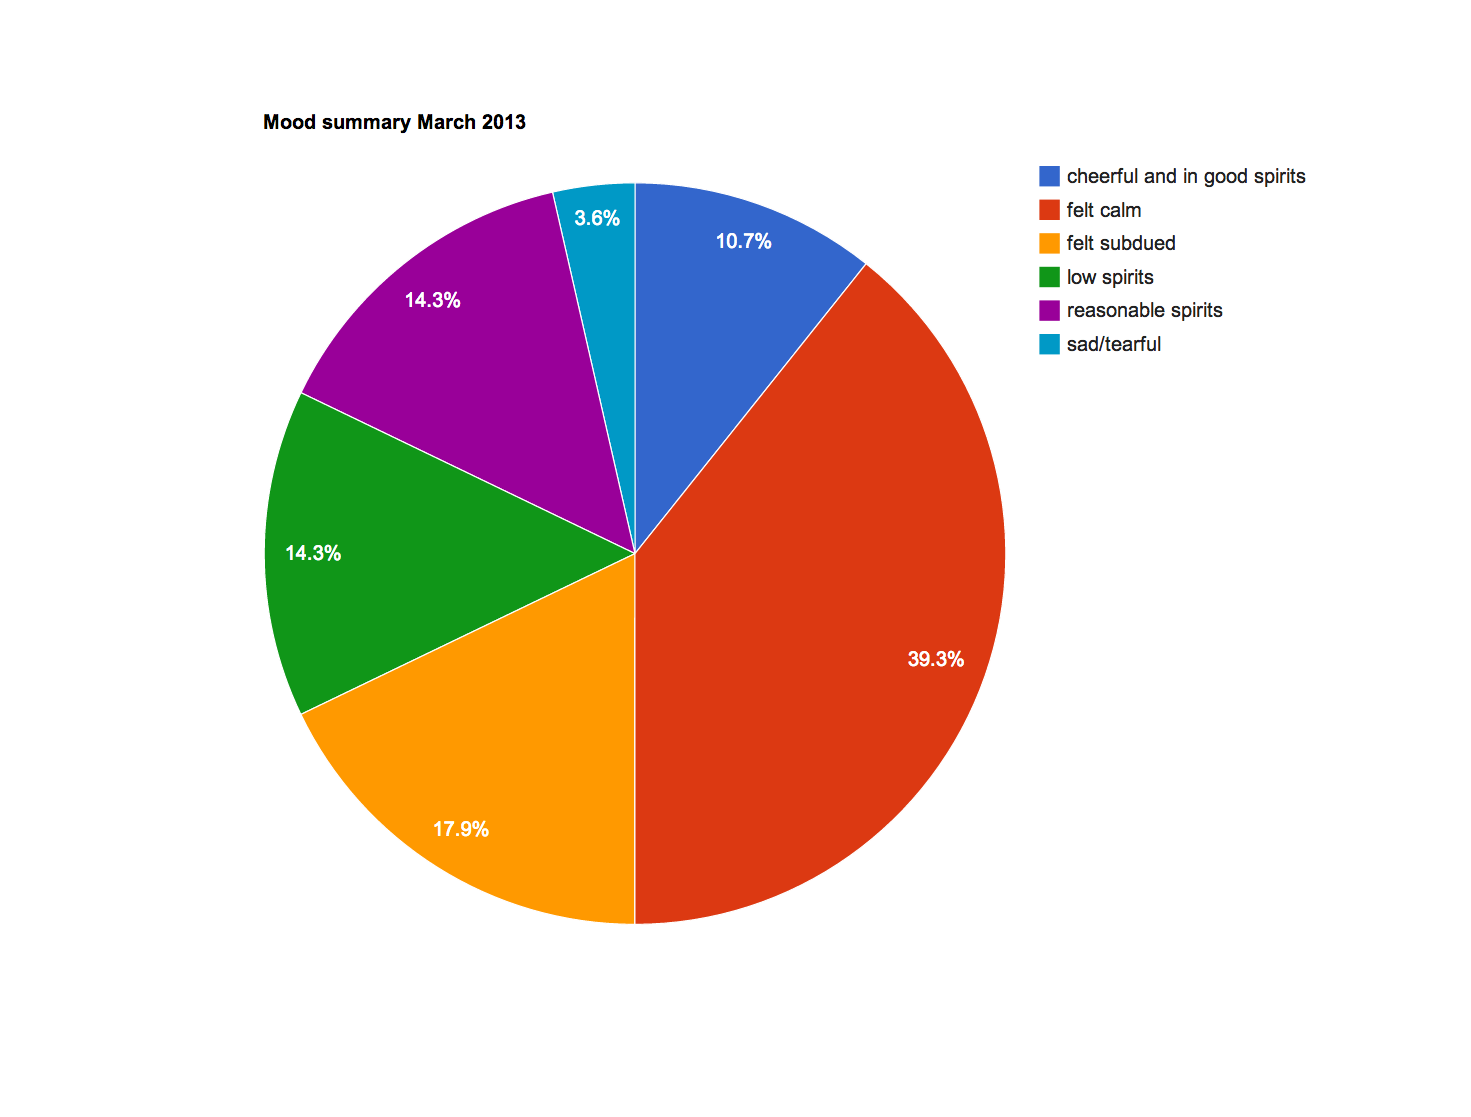
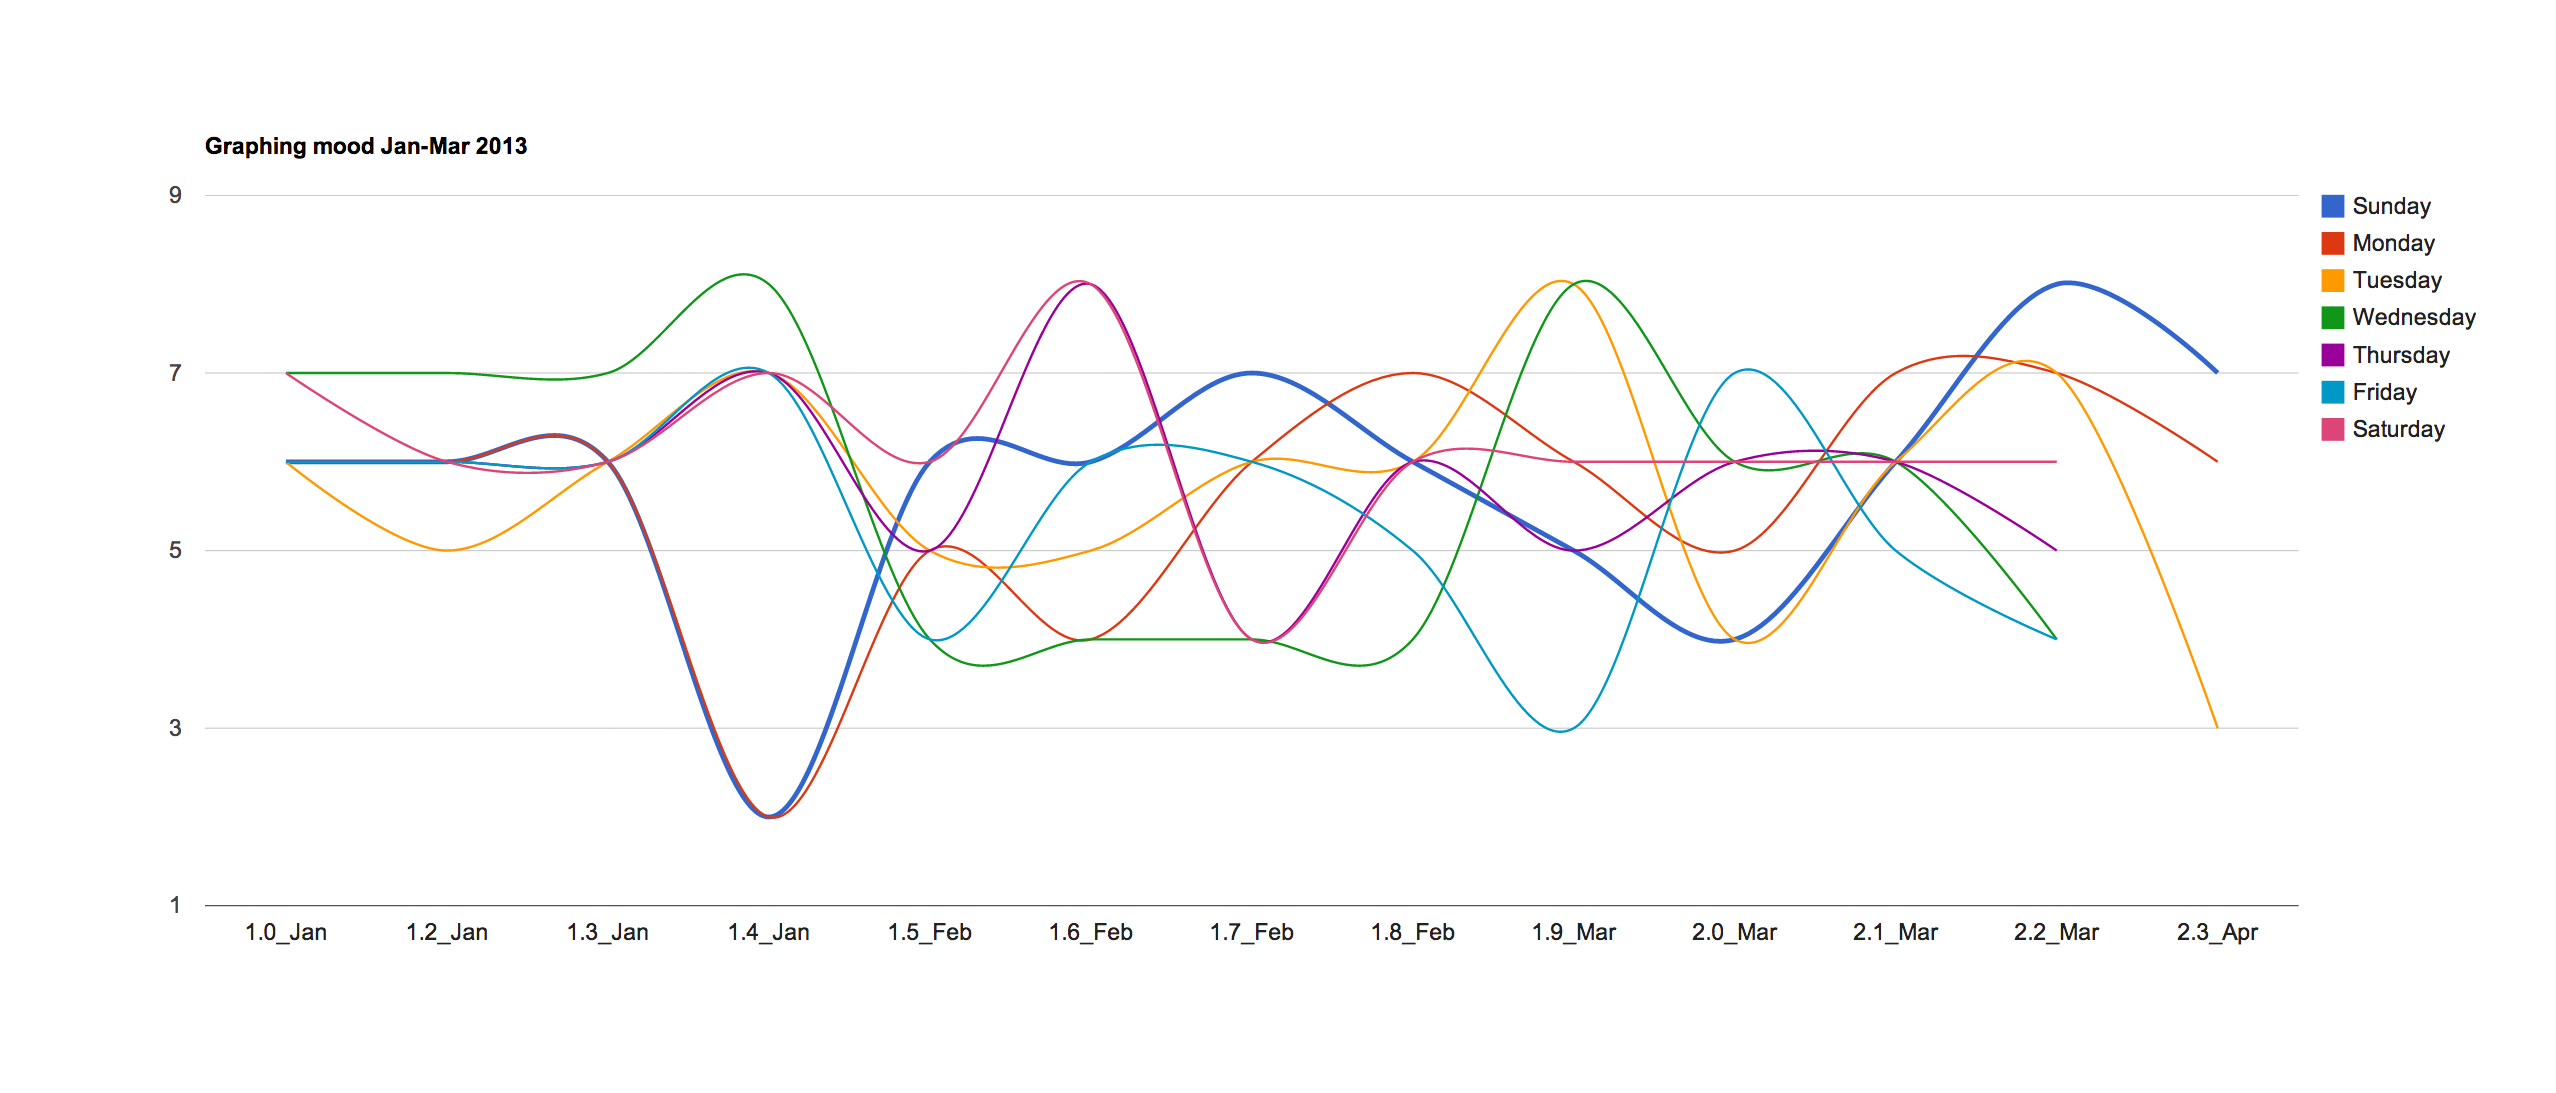
Mood (top image): highest of 8 (cheerful and in good spirits) and a low of 3 (sad tearful).
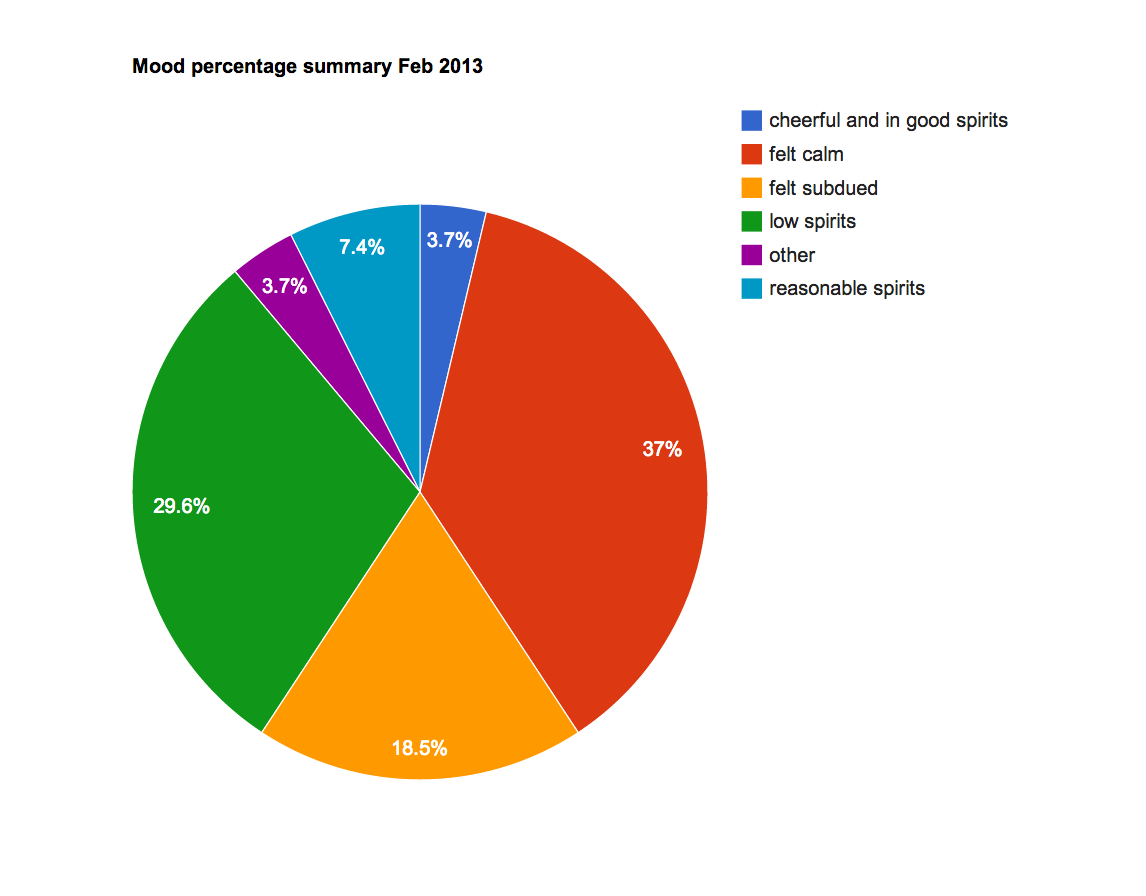
Looking at the percentage breakdown, I felt calm for most of the time with a similar level to last month. My feelings of being subdued were also similar with a slight drop. The big change comes in the numbers for low spirits and reasonable spirits with the former dropping from 29% to 14% and the doubling from 7 to 14%. There is also a spike in my “cheerful and in good spirits” rose from 3 to 10%. Mostly then the positive scores have risen and the negative scores dropped. You have to be careful here because some of these shifts are pretty minimal, but interesting nevertheless. The end of the month was quite grim, which doesn’t seem reflected here. It was however, a creative productive month which perhaps is.
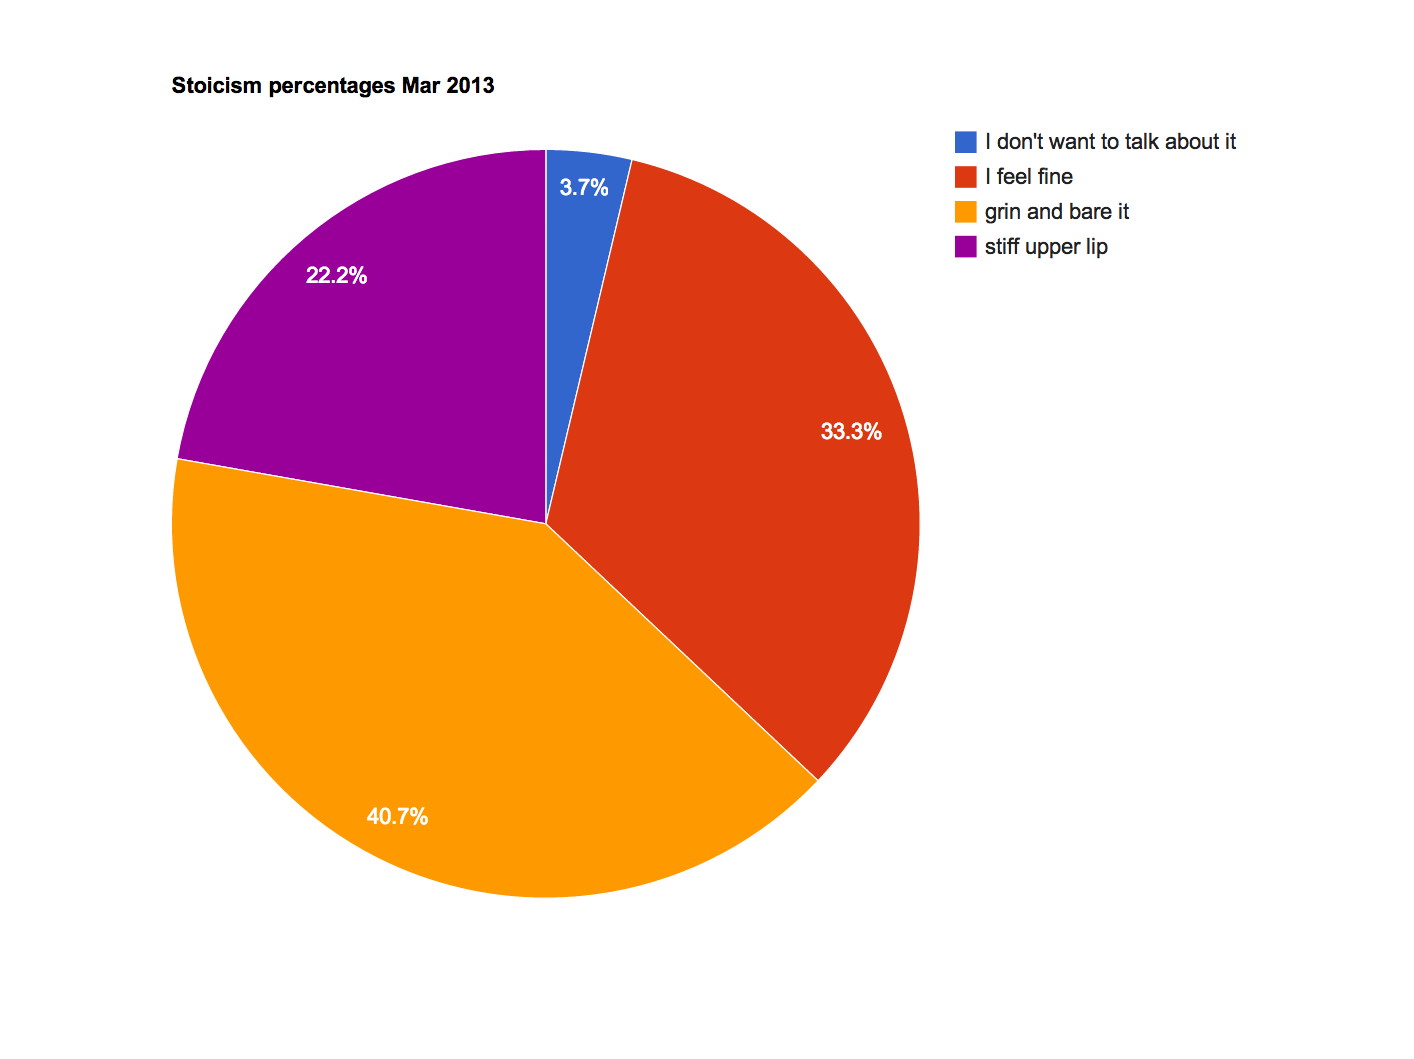
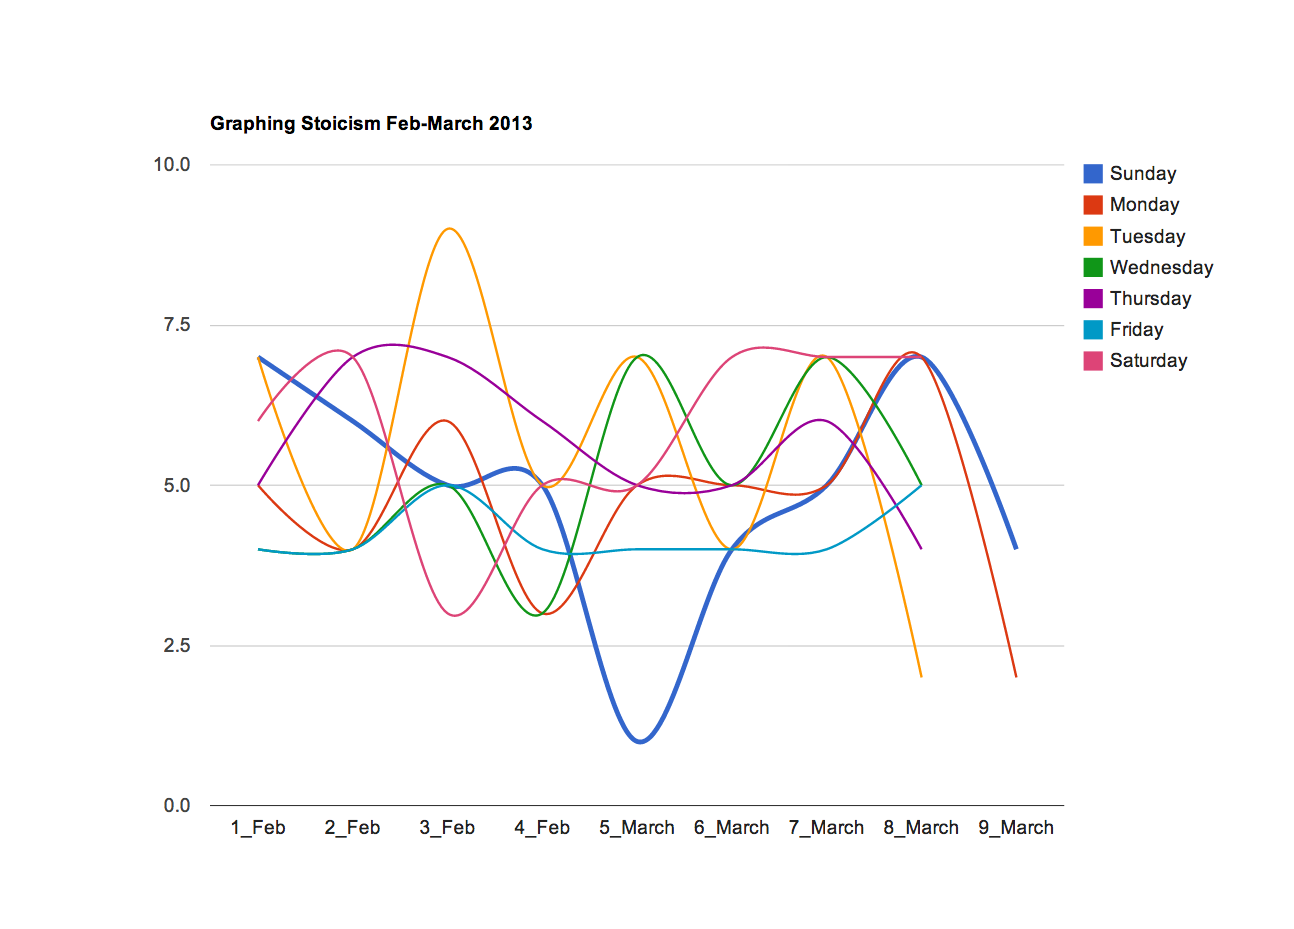
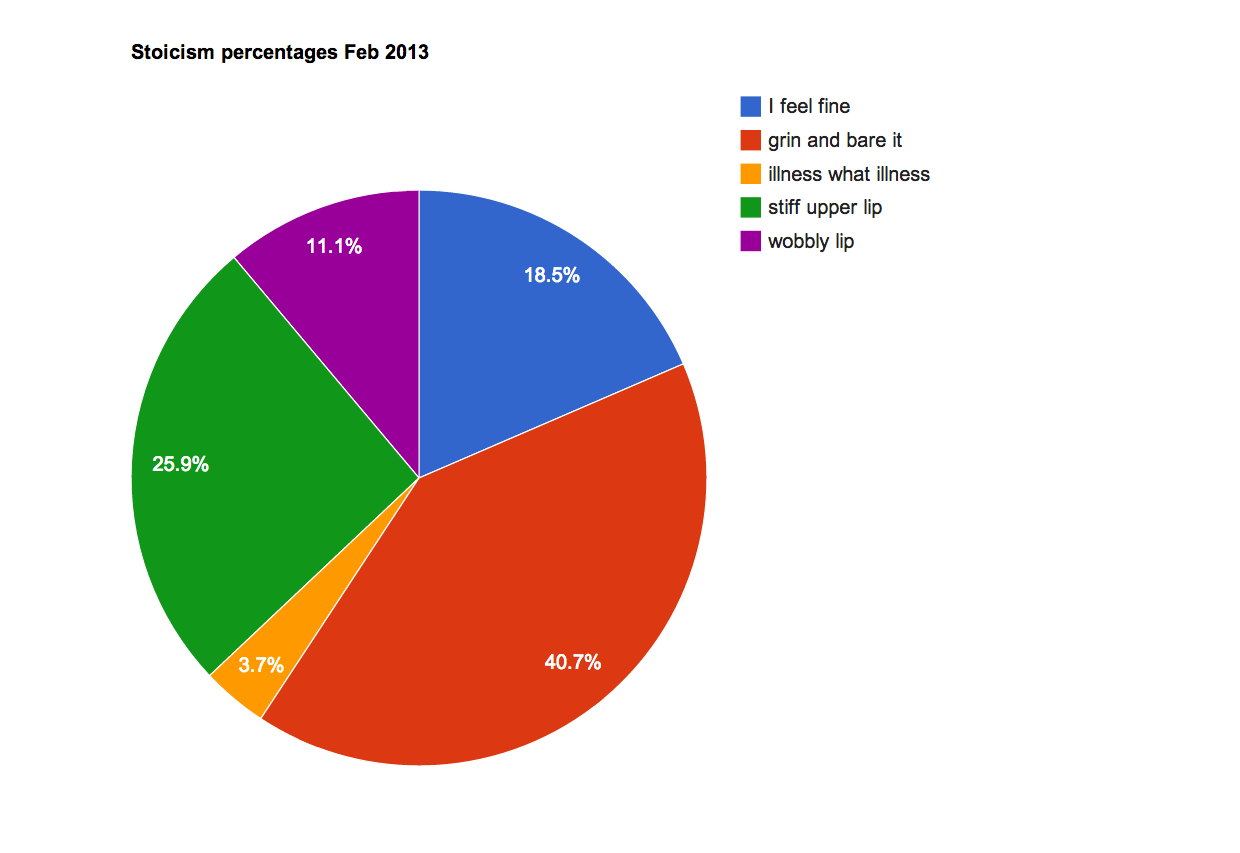
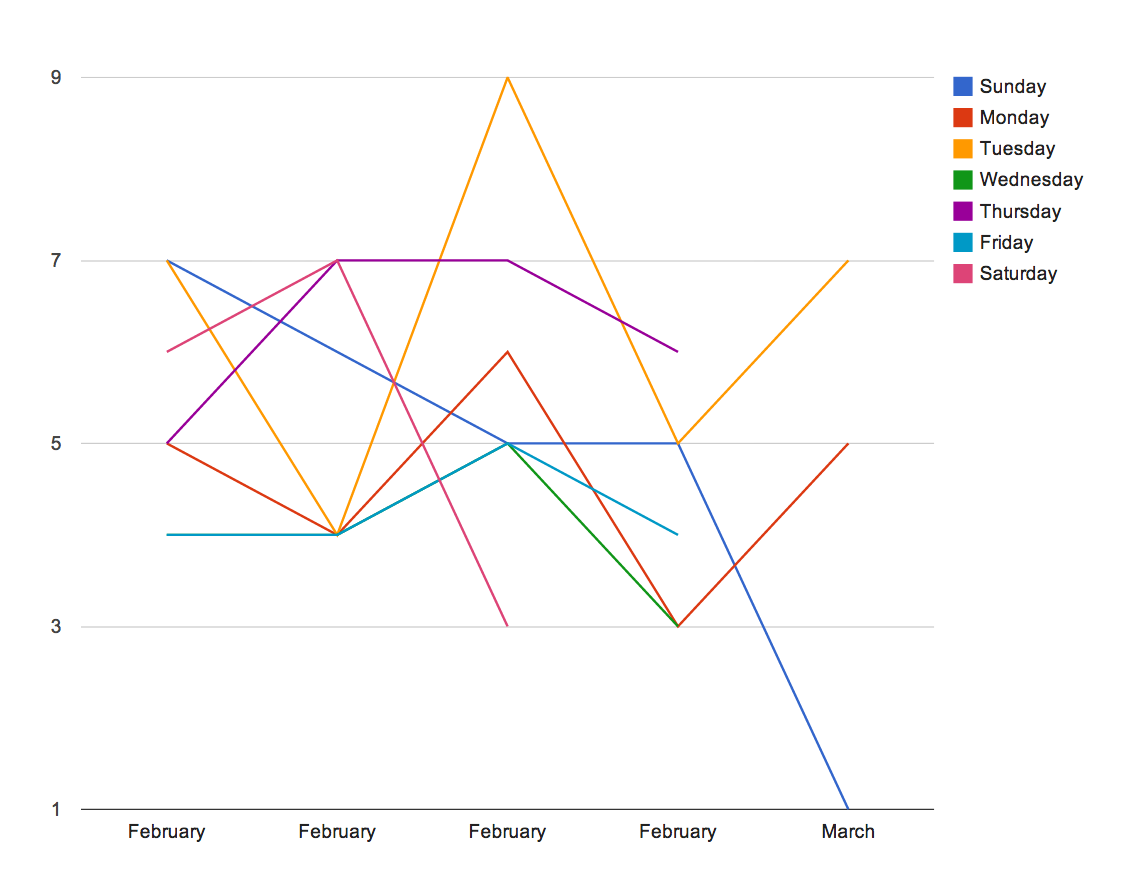
Stoicism: a high of 7 (I feel fine) and a low of 1 (I don’t want to talk about it)
Grin and bare it at 40% is identical to last month, whereas I feel fine is up from 18% to 33%. That’s quite a leap. My stiff upper lip jutted out slightly less often this month but it didn’t wobble once. Similar to the mood numbers I’m generally coping with rises in positive responses and slight drops in the grimmer end of the index. It will be interesting to see the indexes for April as winter drags on into months which it shouldn’t trouble.
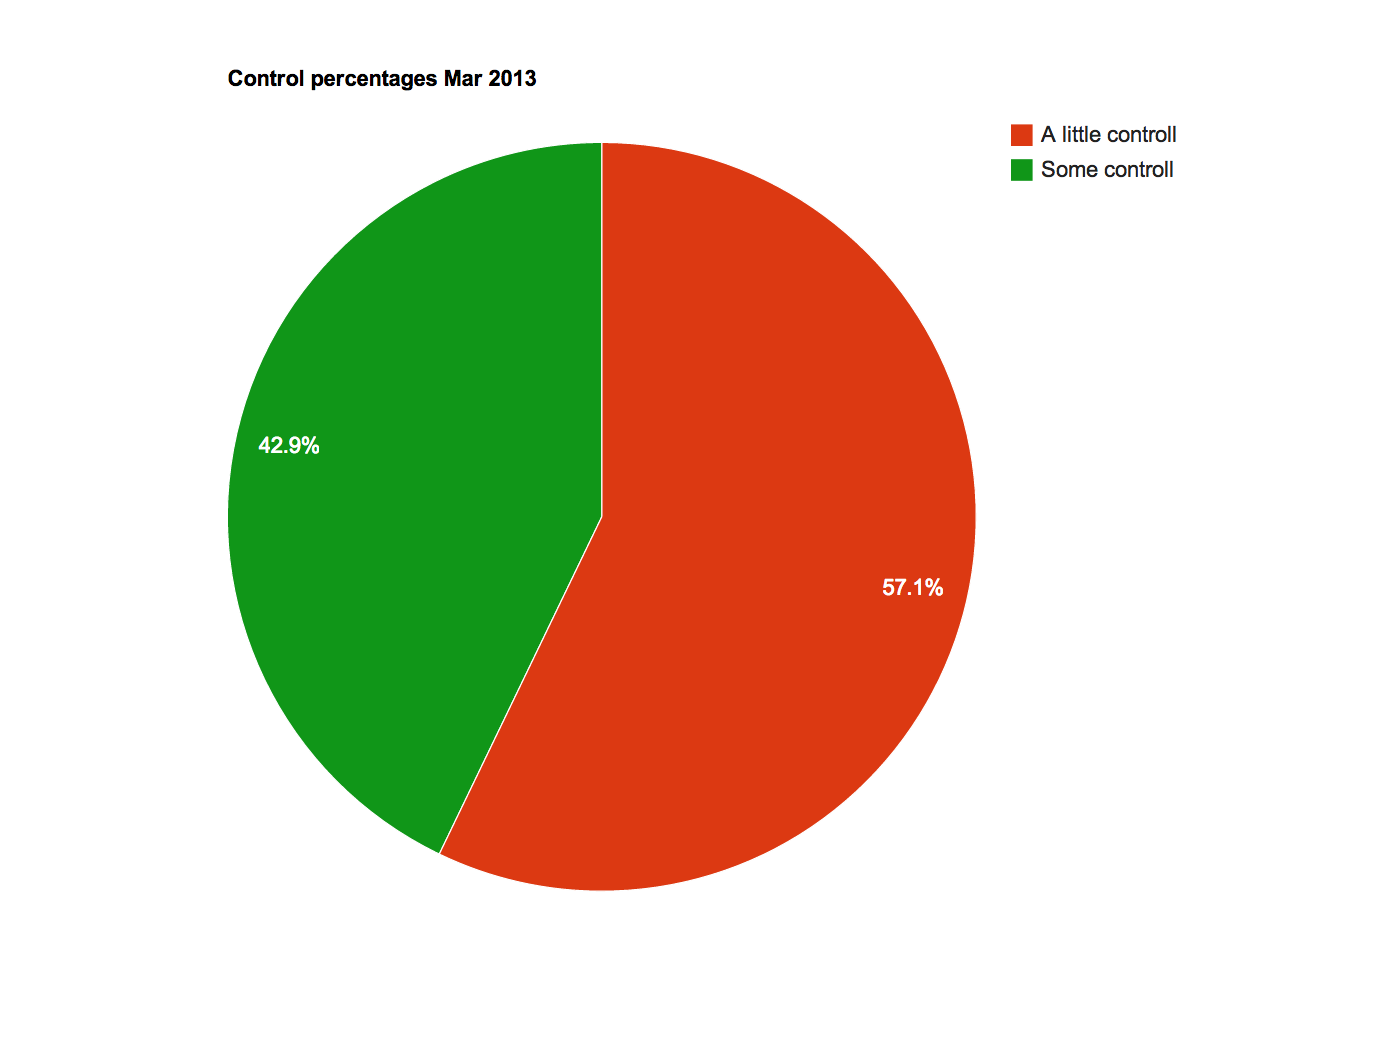
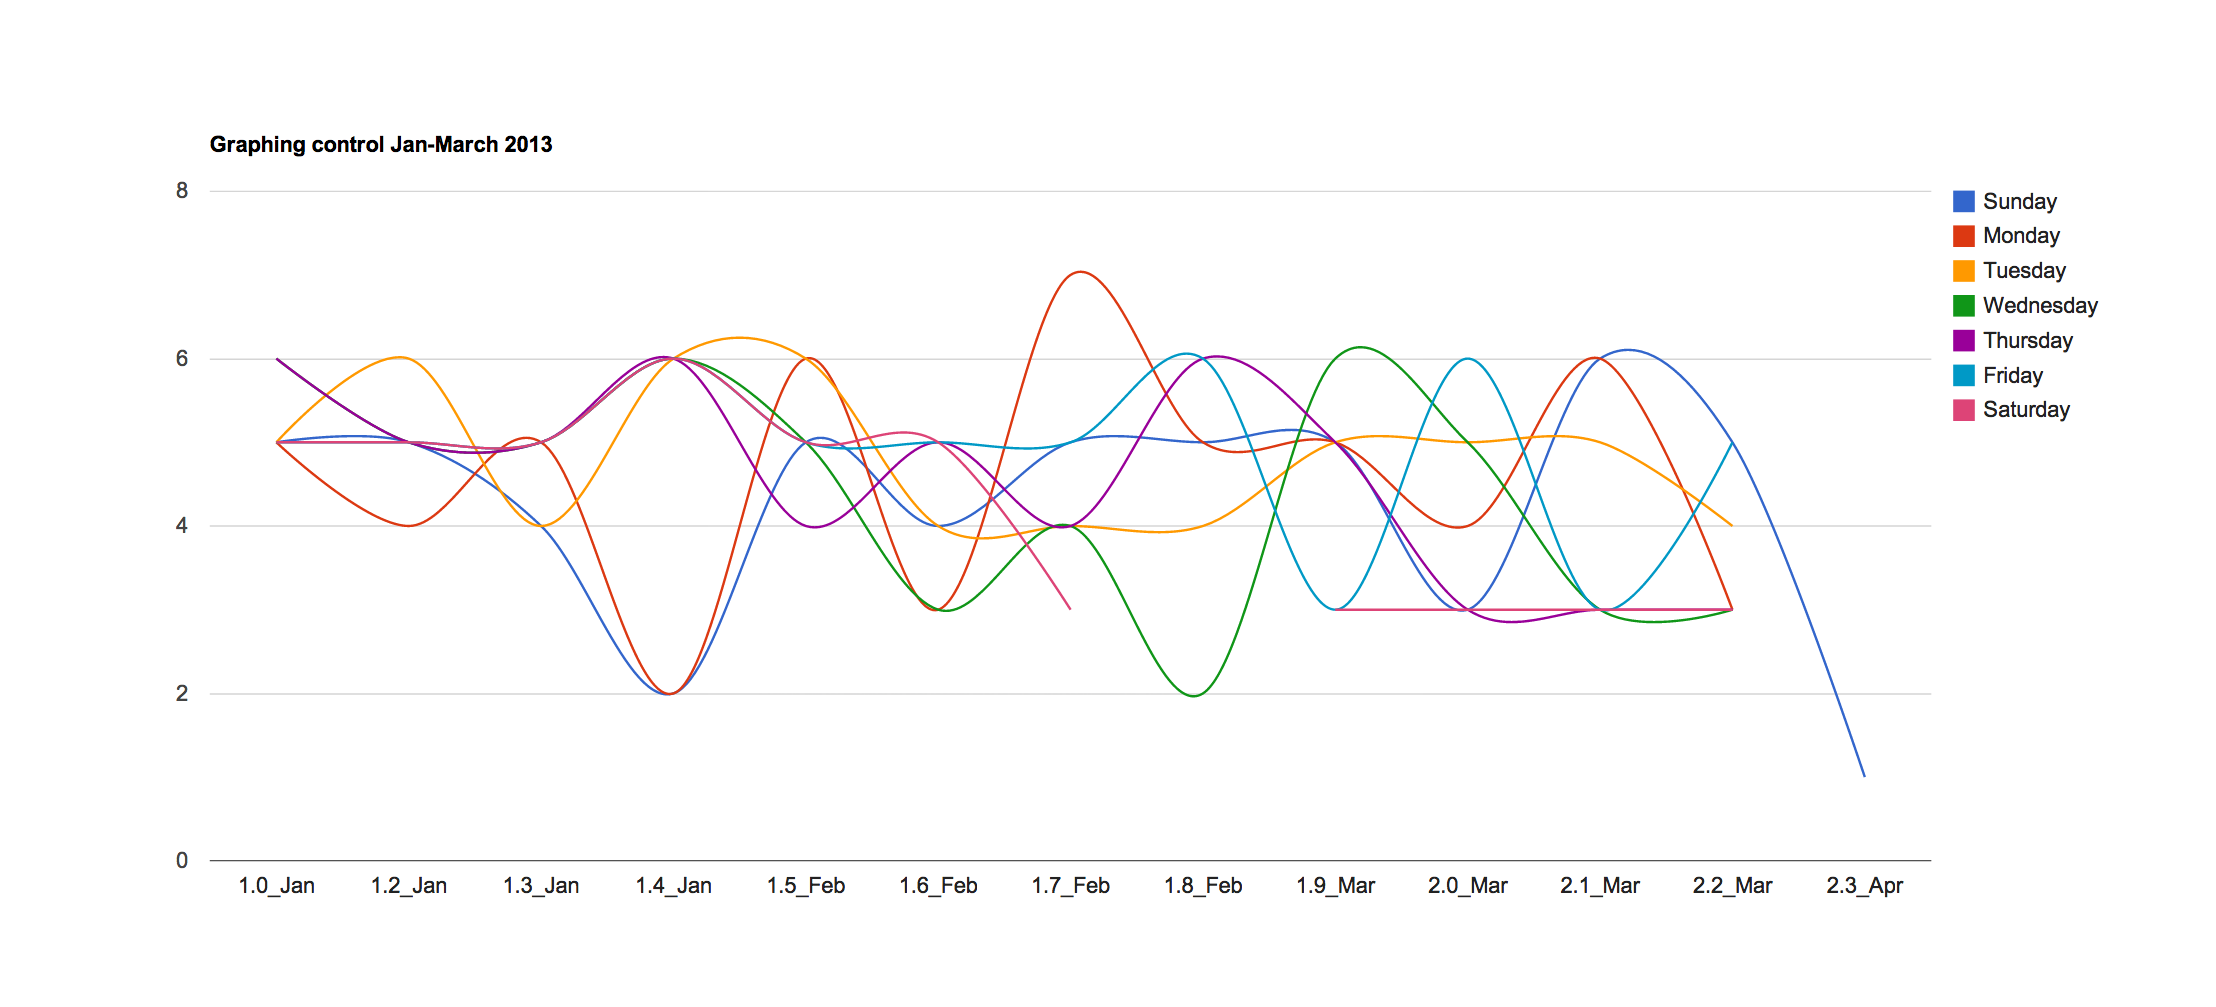
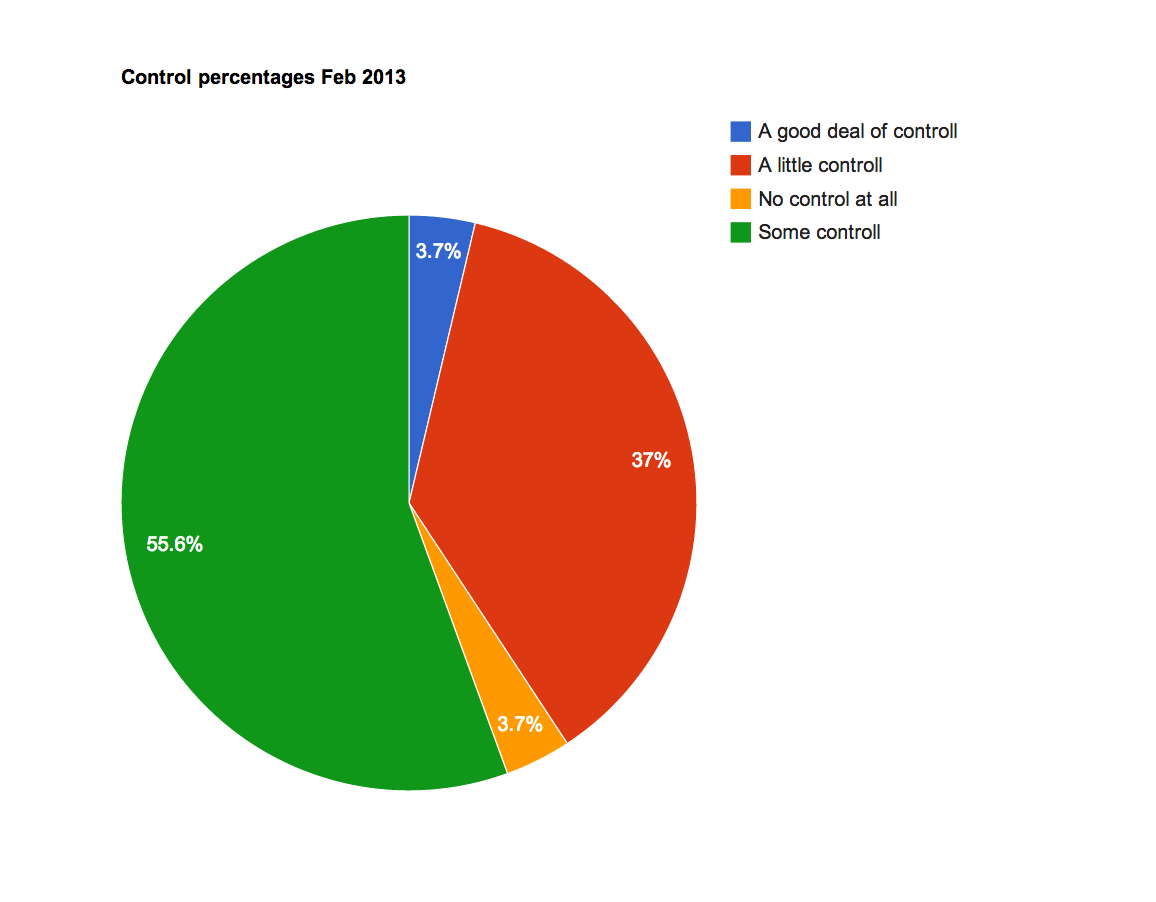
Control: a high of 6 (some control) and a low of 3 (a little control).
The index here swings between 3 and 6, predominantly showing ‘a little control’. It’s steady stuff with no spikes unlike last month with increases on the negative and a drop in the steadier areas. This goes against the grain of the previous two indexes. It’s tempting to read more into this than is the case, I will hold back from opinion until I see April’s scores.

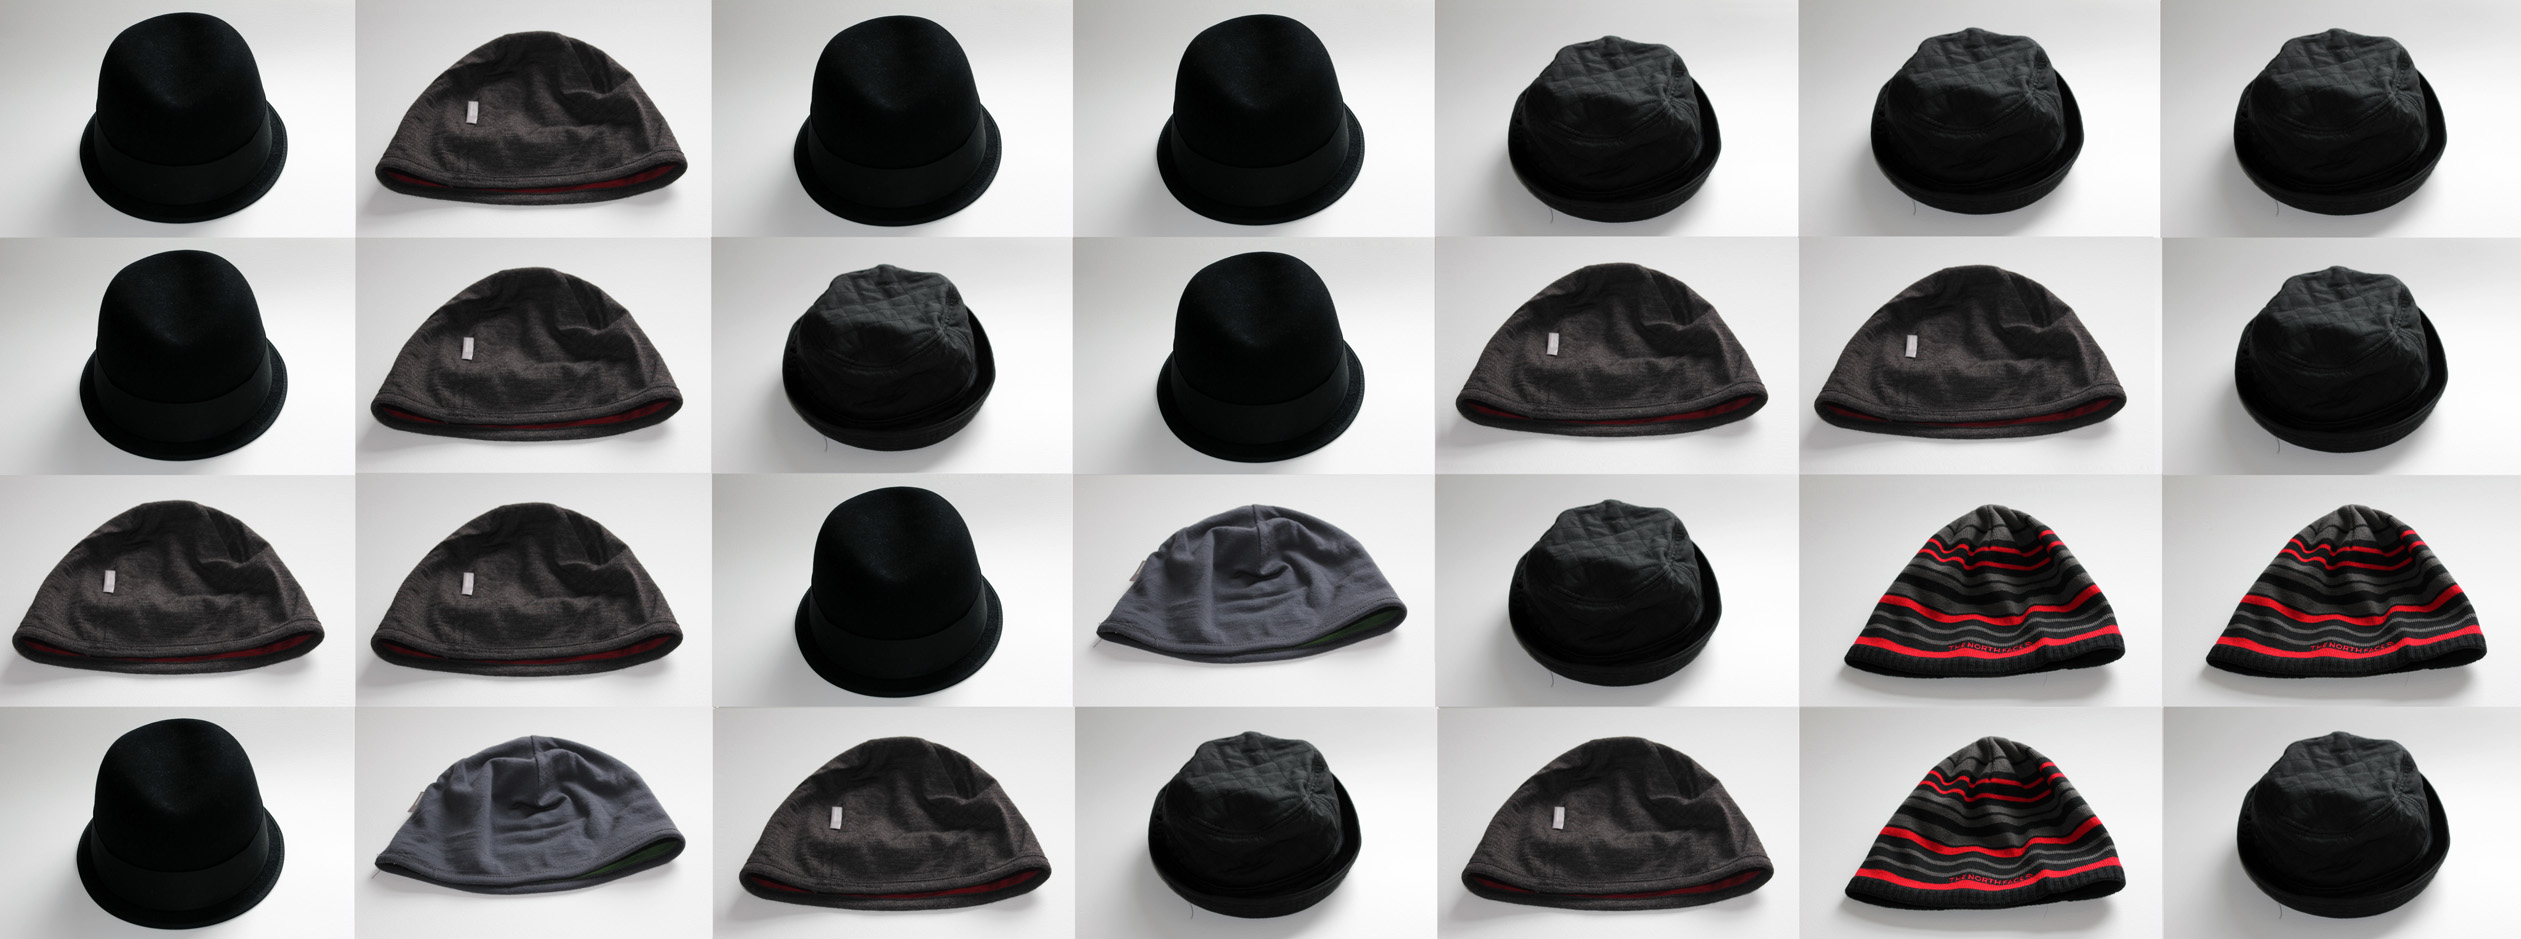
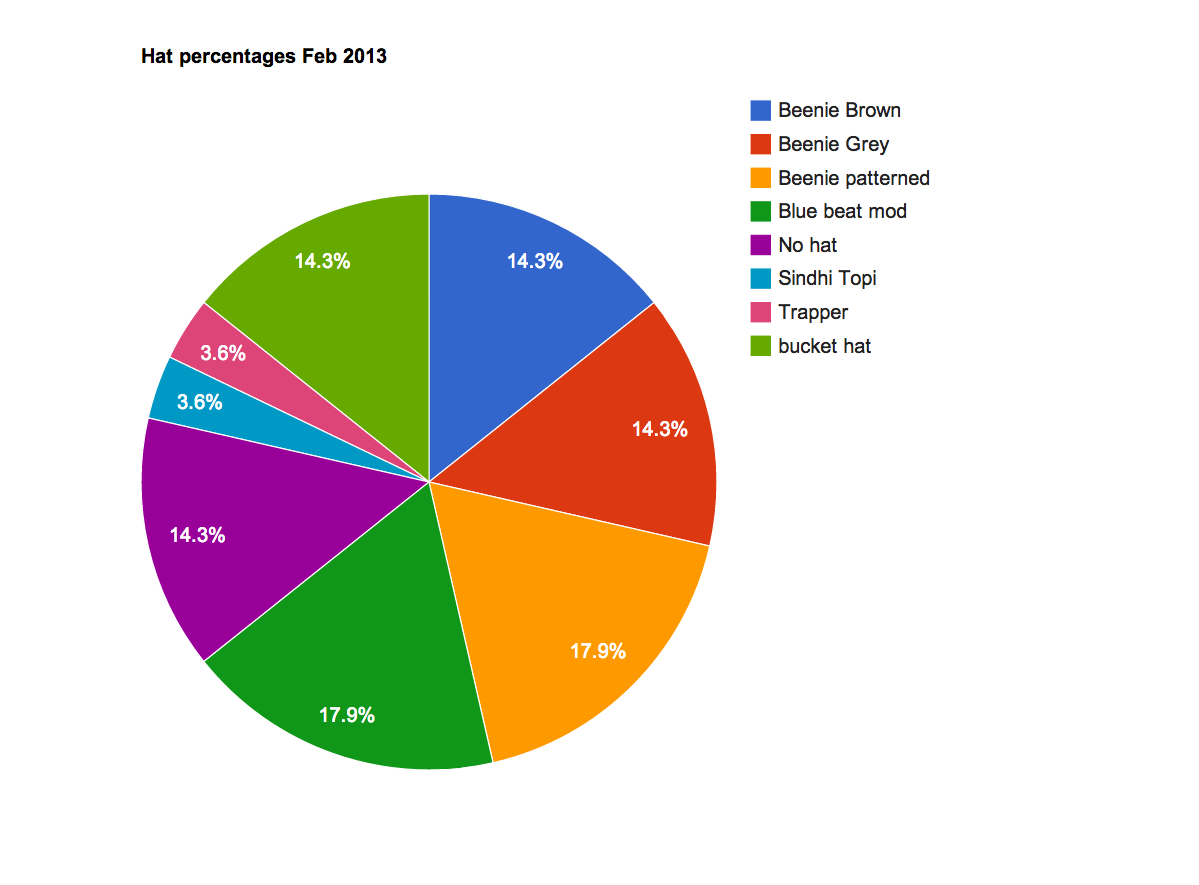
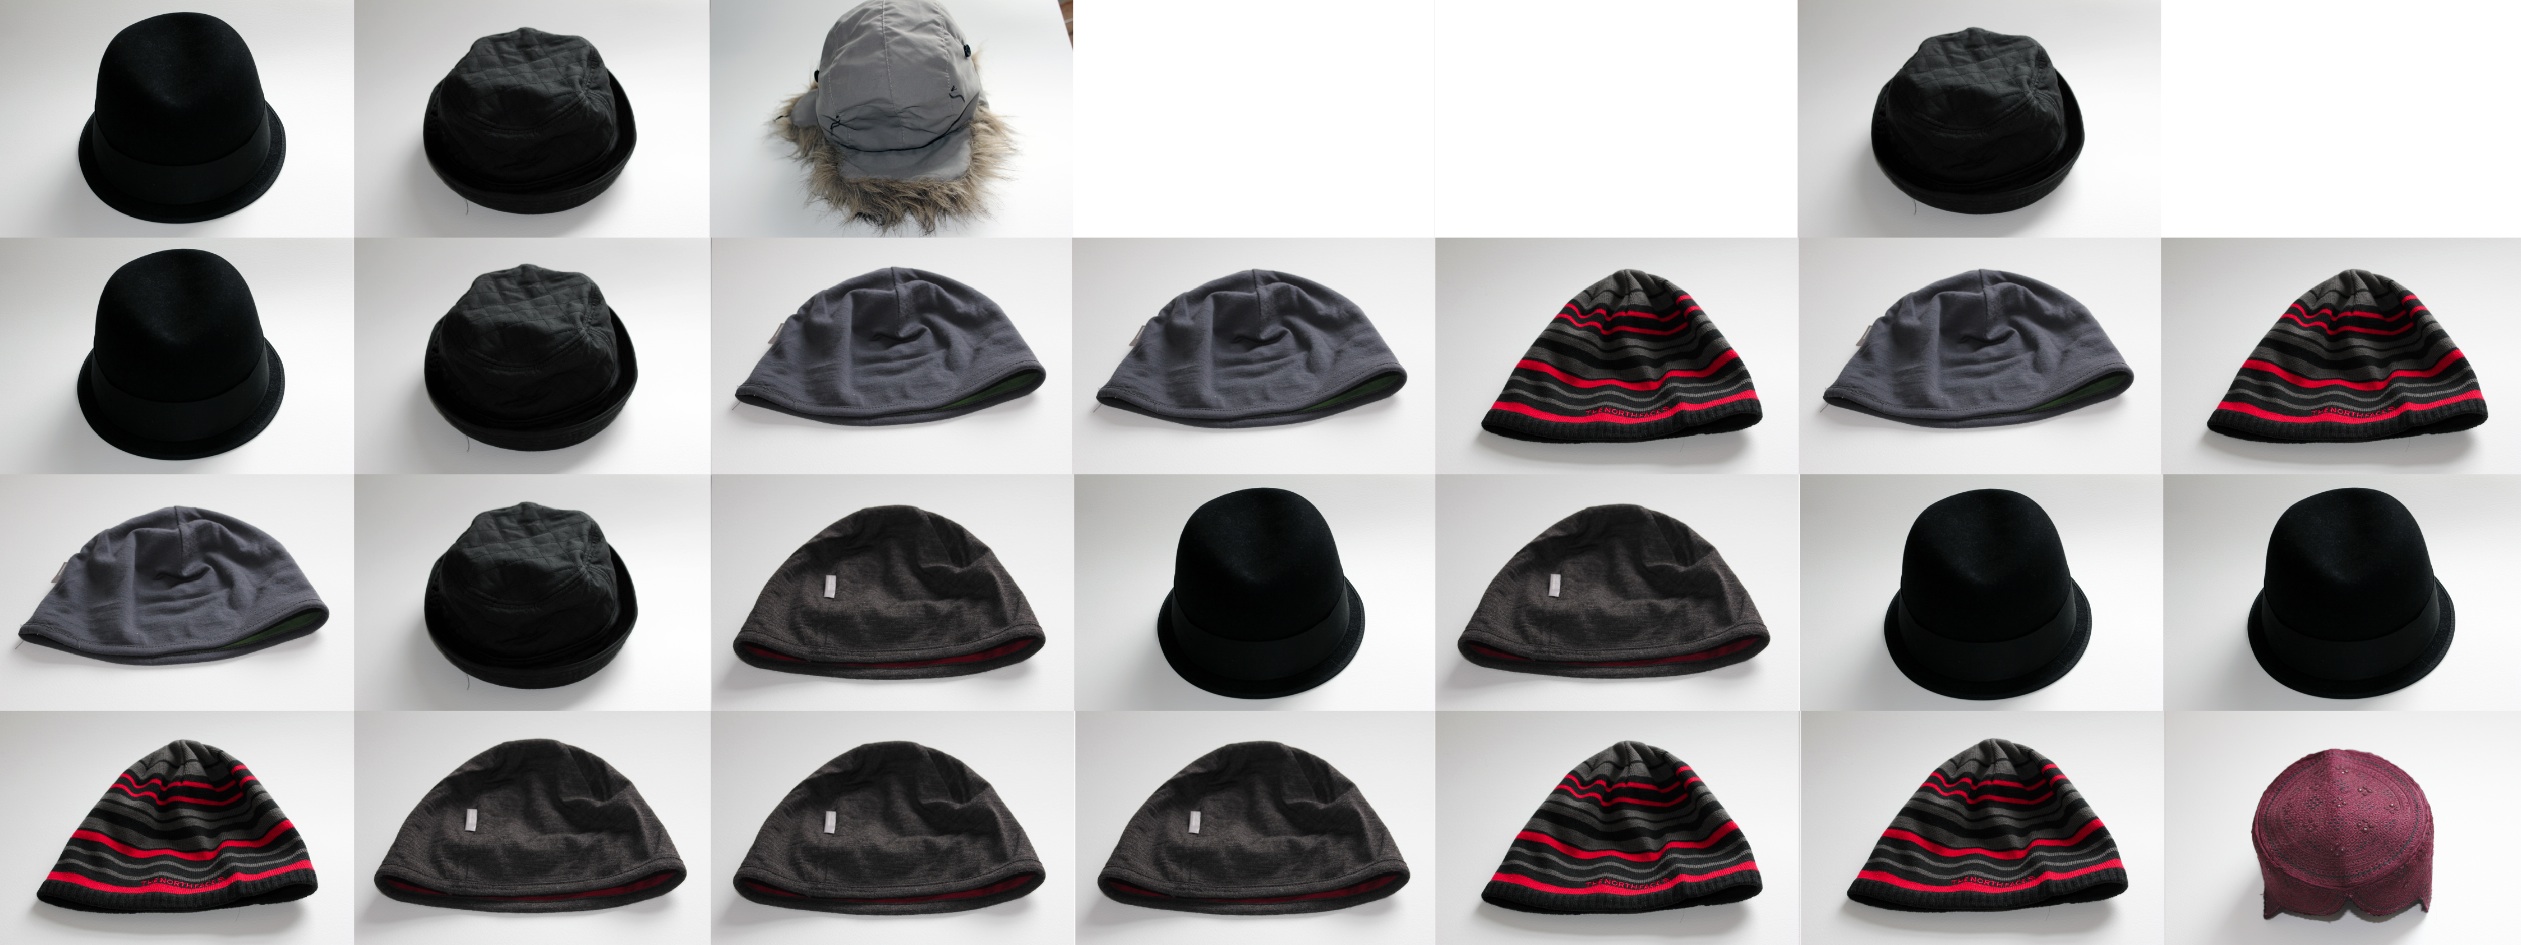
This months hats will be skewed as many of them have gone on holiday to Istanbul for exhibition purposes. I have some duplicates though so there are some similarities to last month. The brown beenie was the predominant hat of choice, which is strange as I have no strong feelings about it. It has been cold though and it’s a good hat for the strange climate change adjusted spring we are suffering. The bucket hat and mod hat were worn roughly a quarter of the time each. Other hats might have been worn if available…..lets see what happens next month.
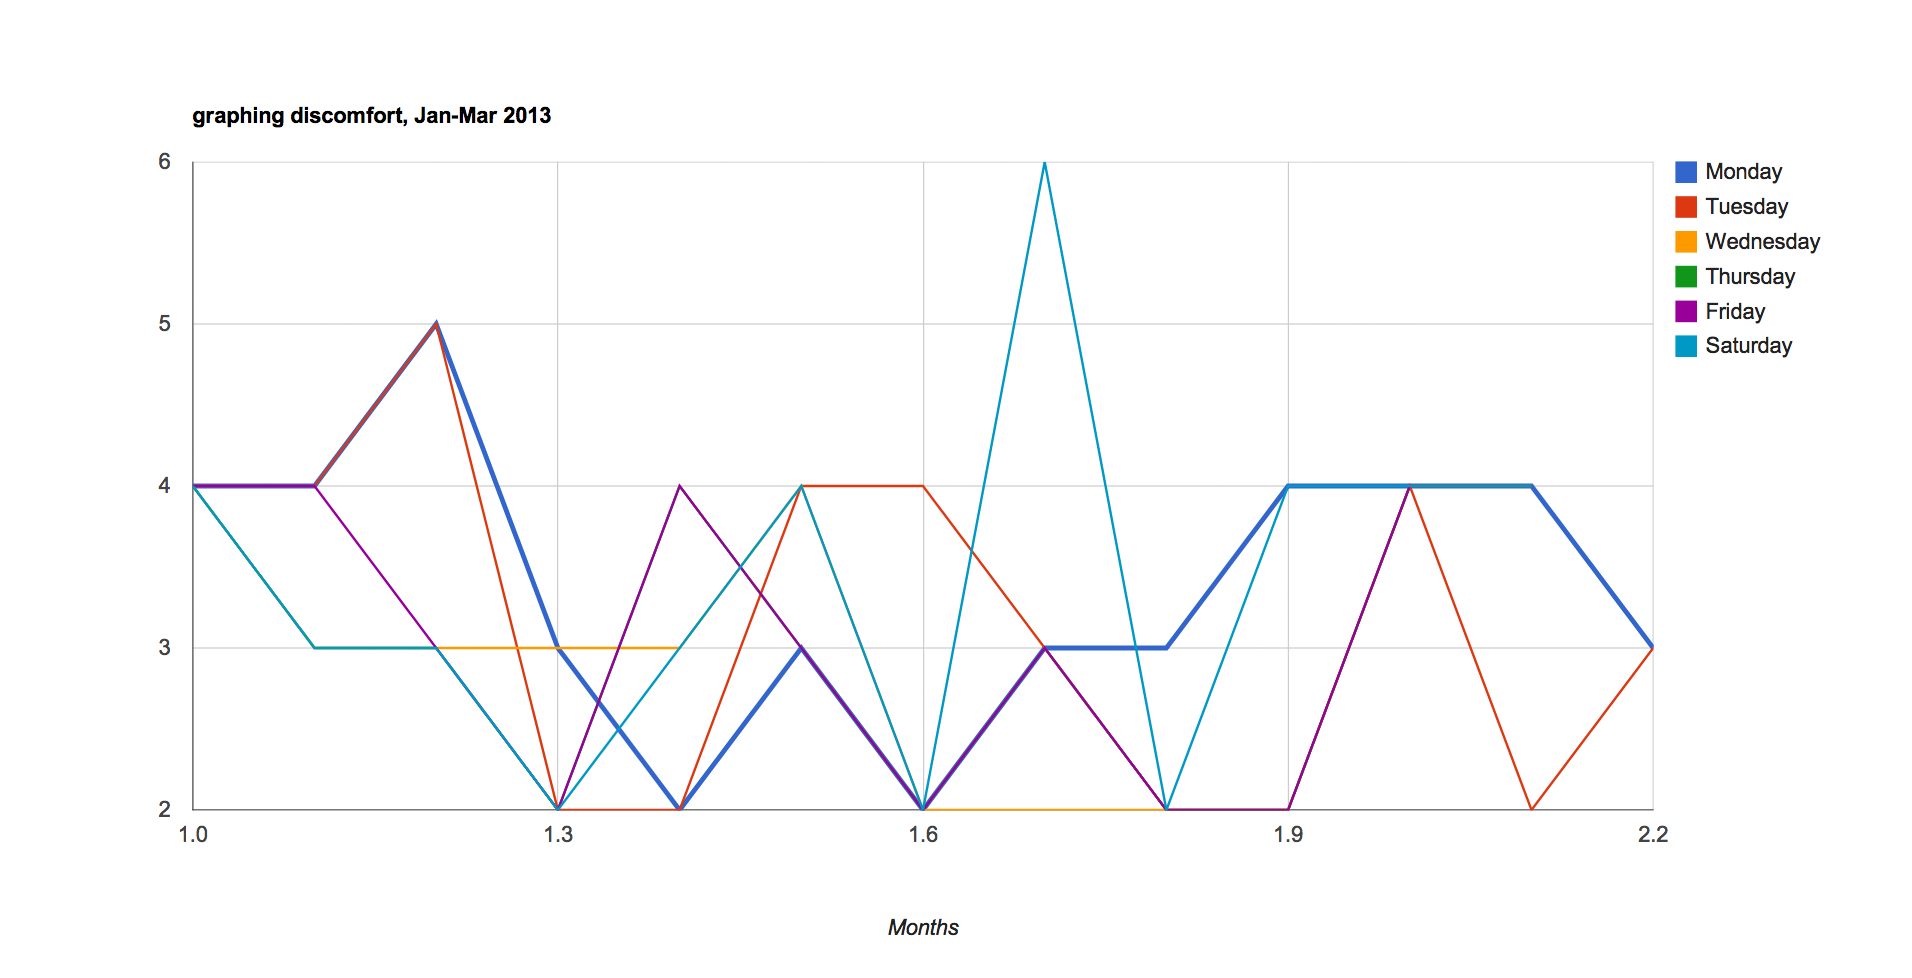
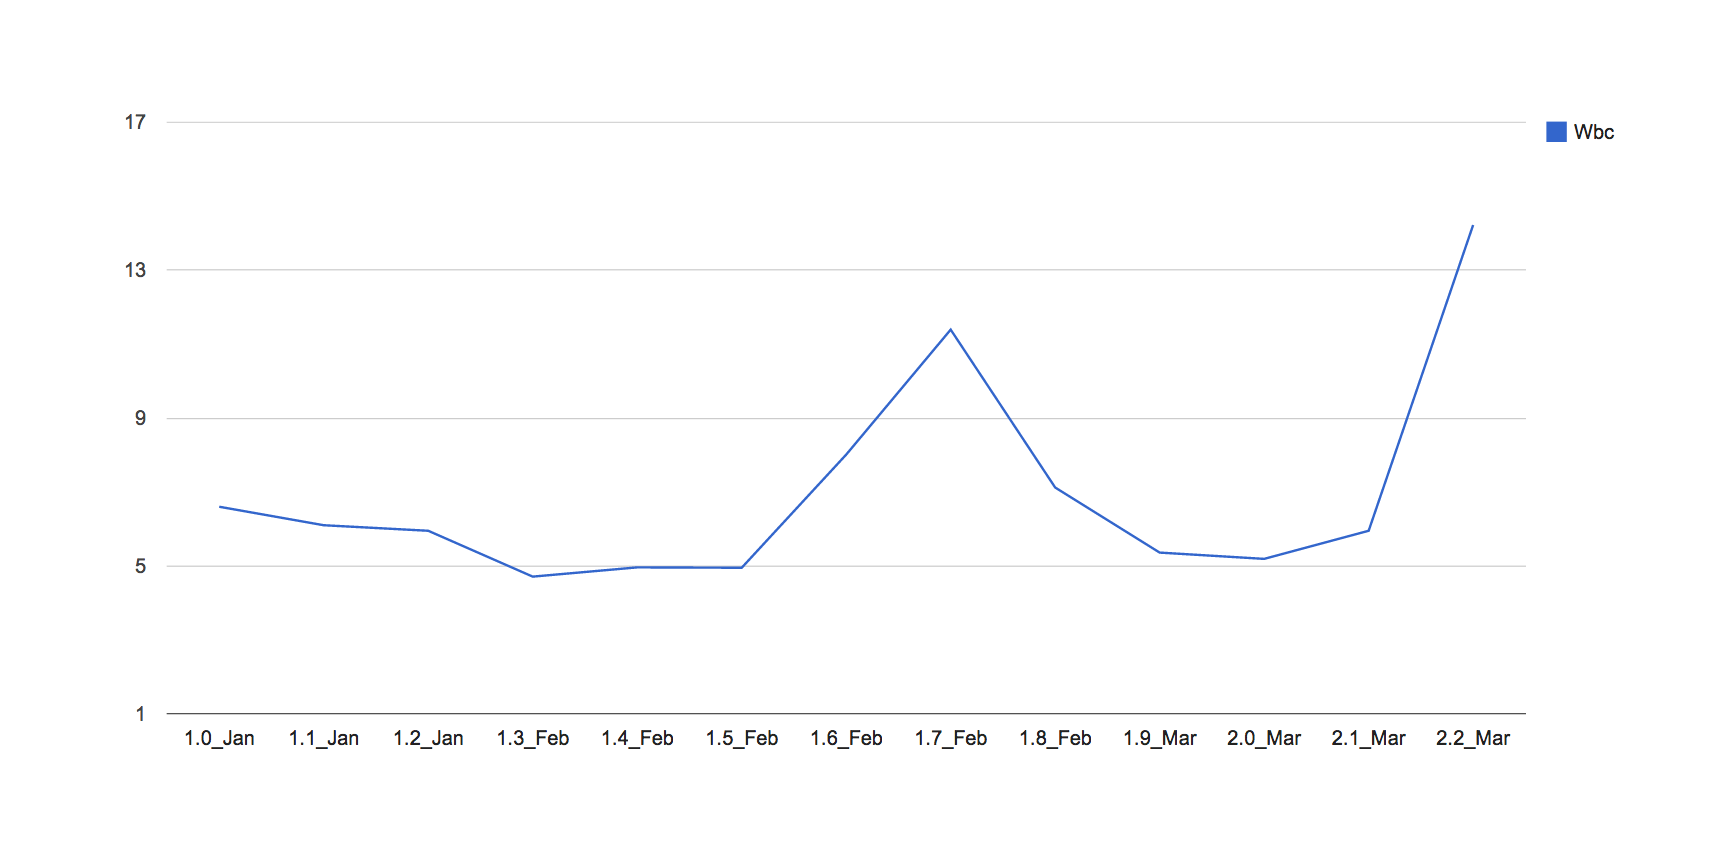
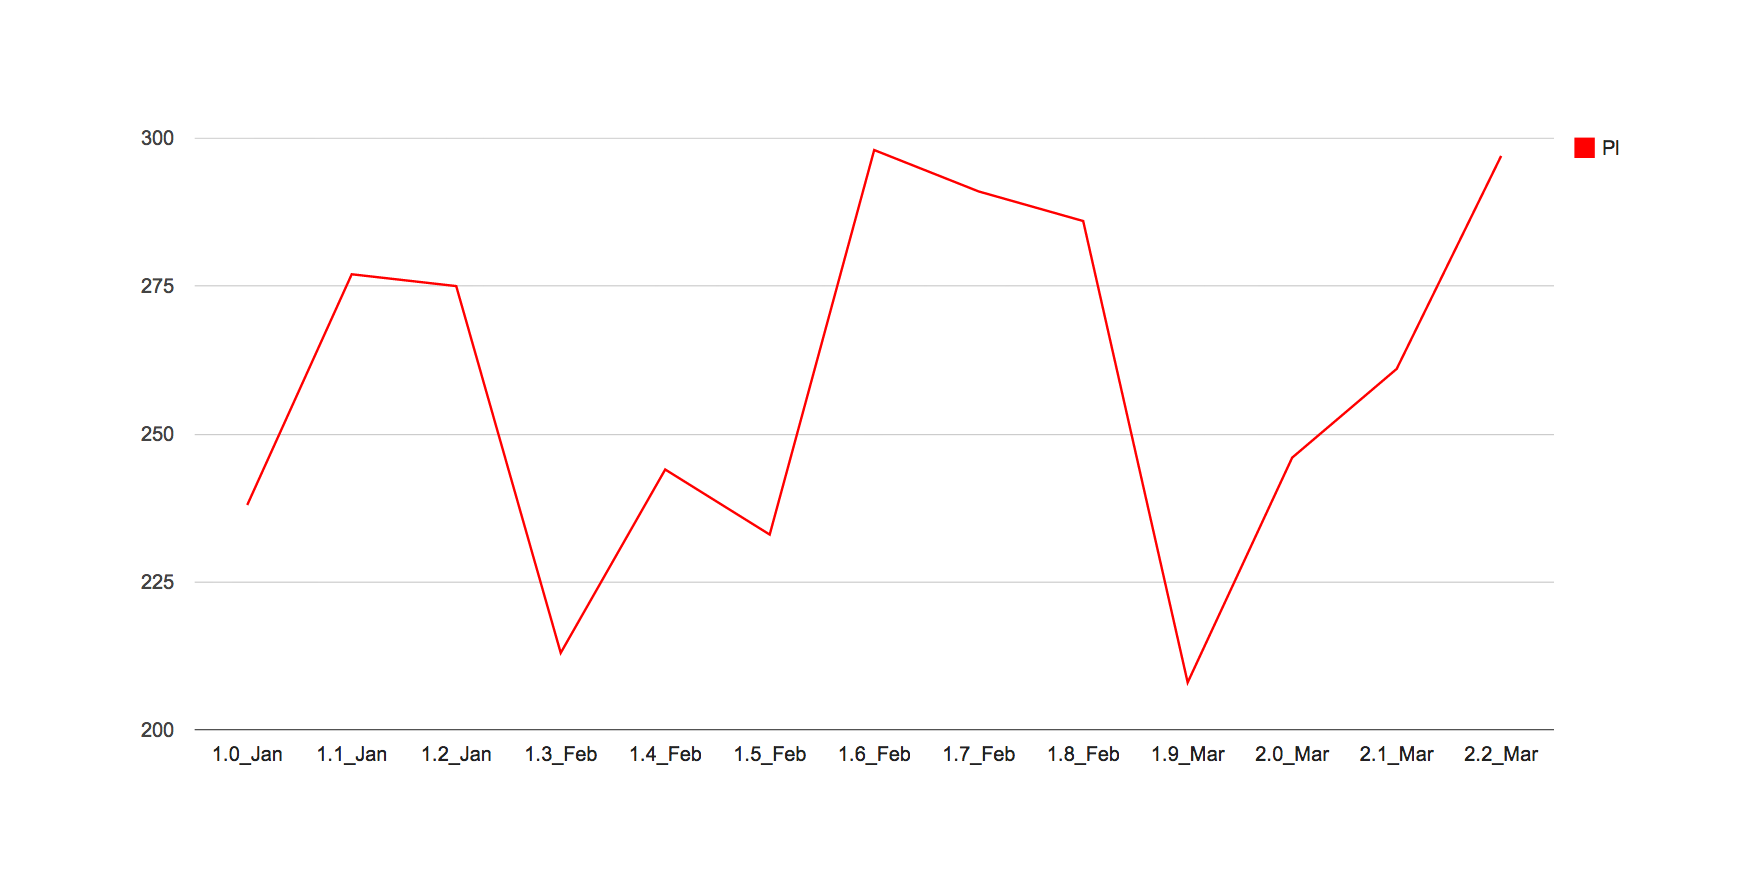
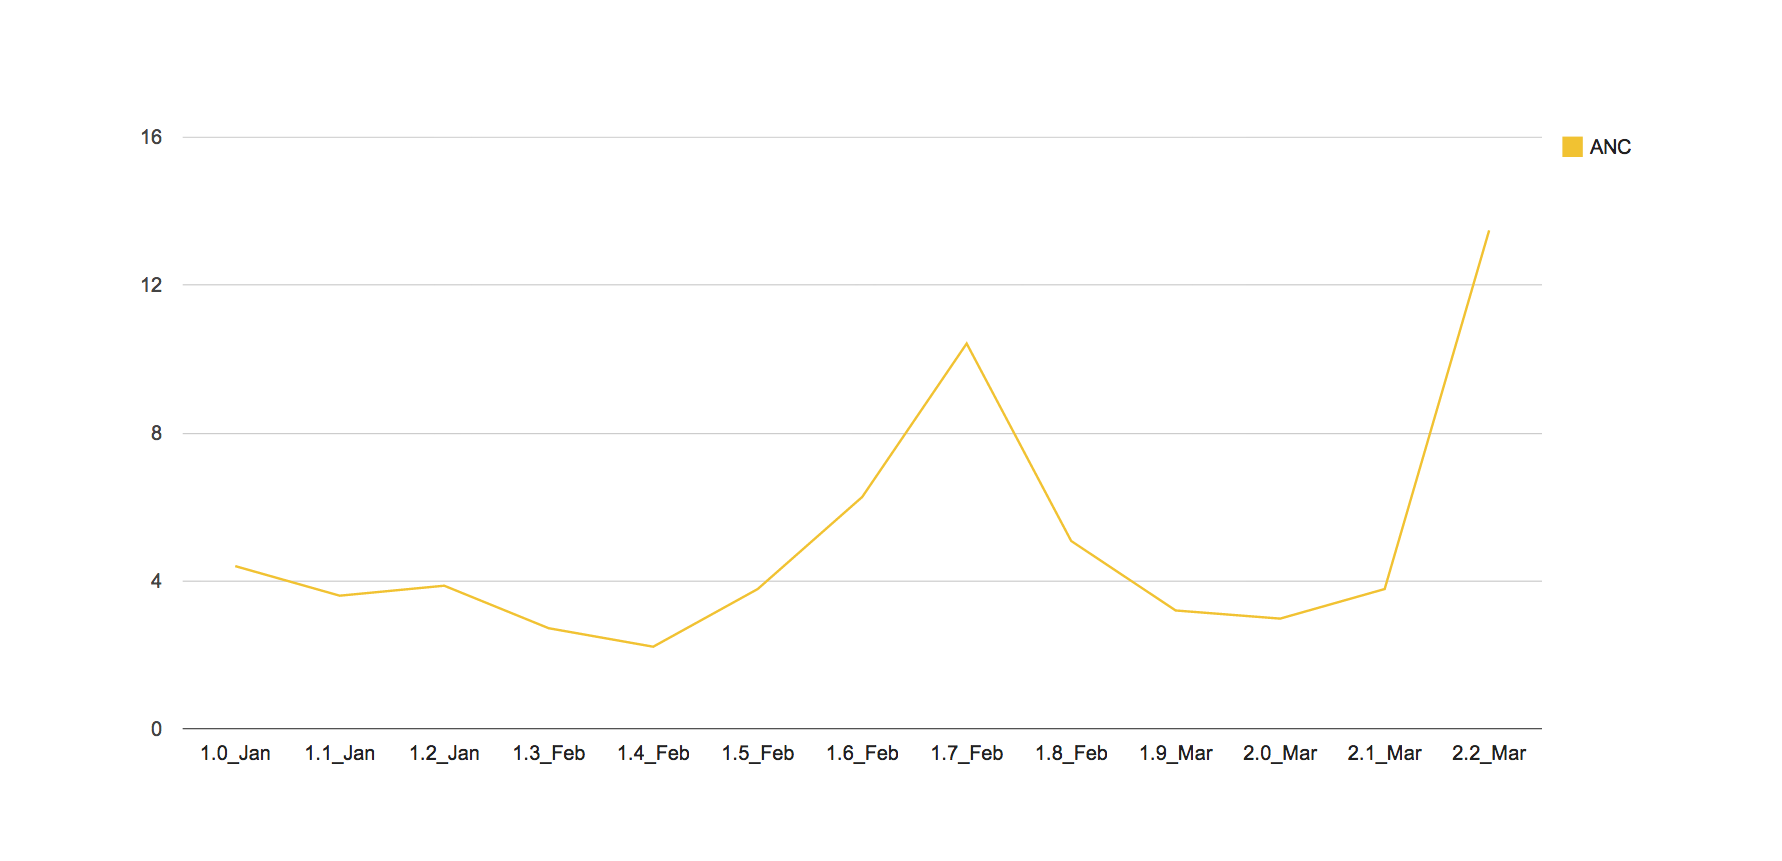
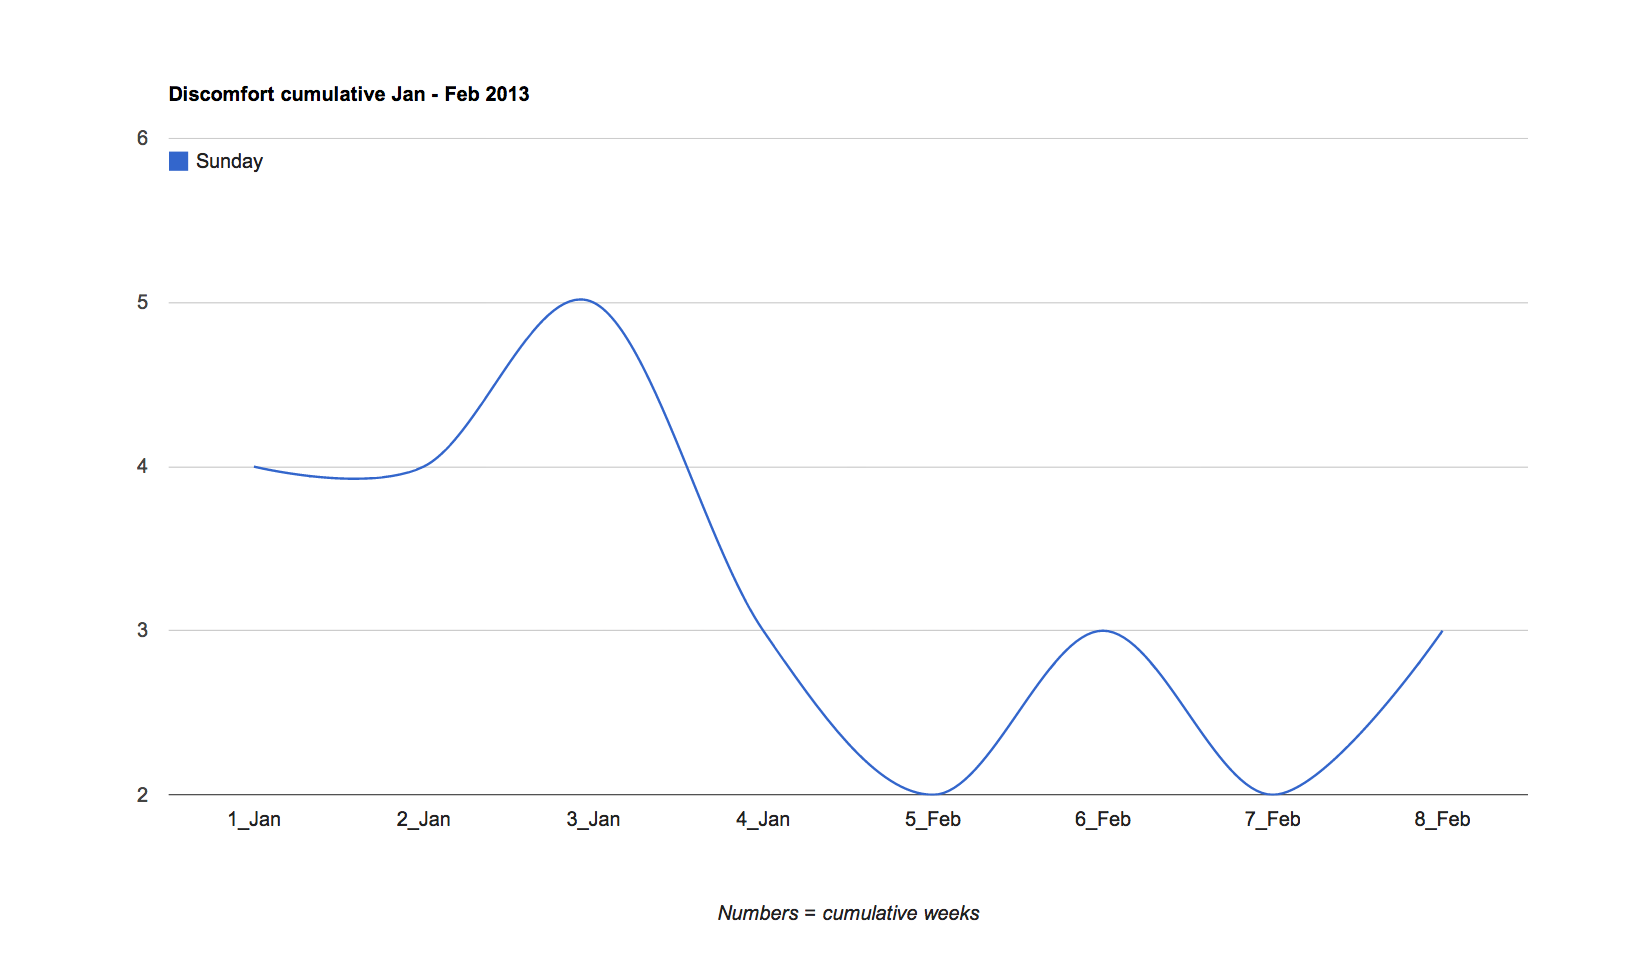
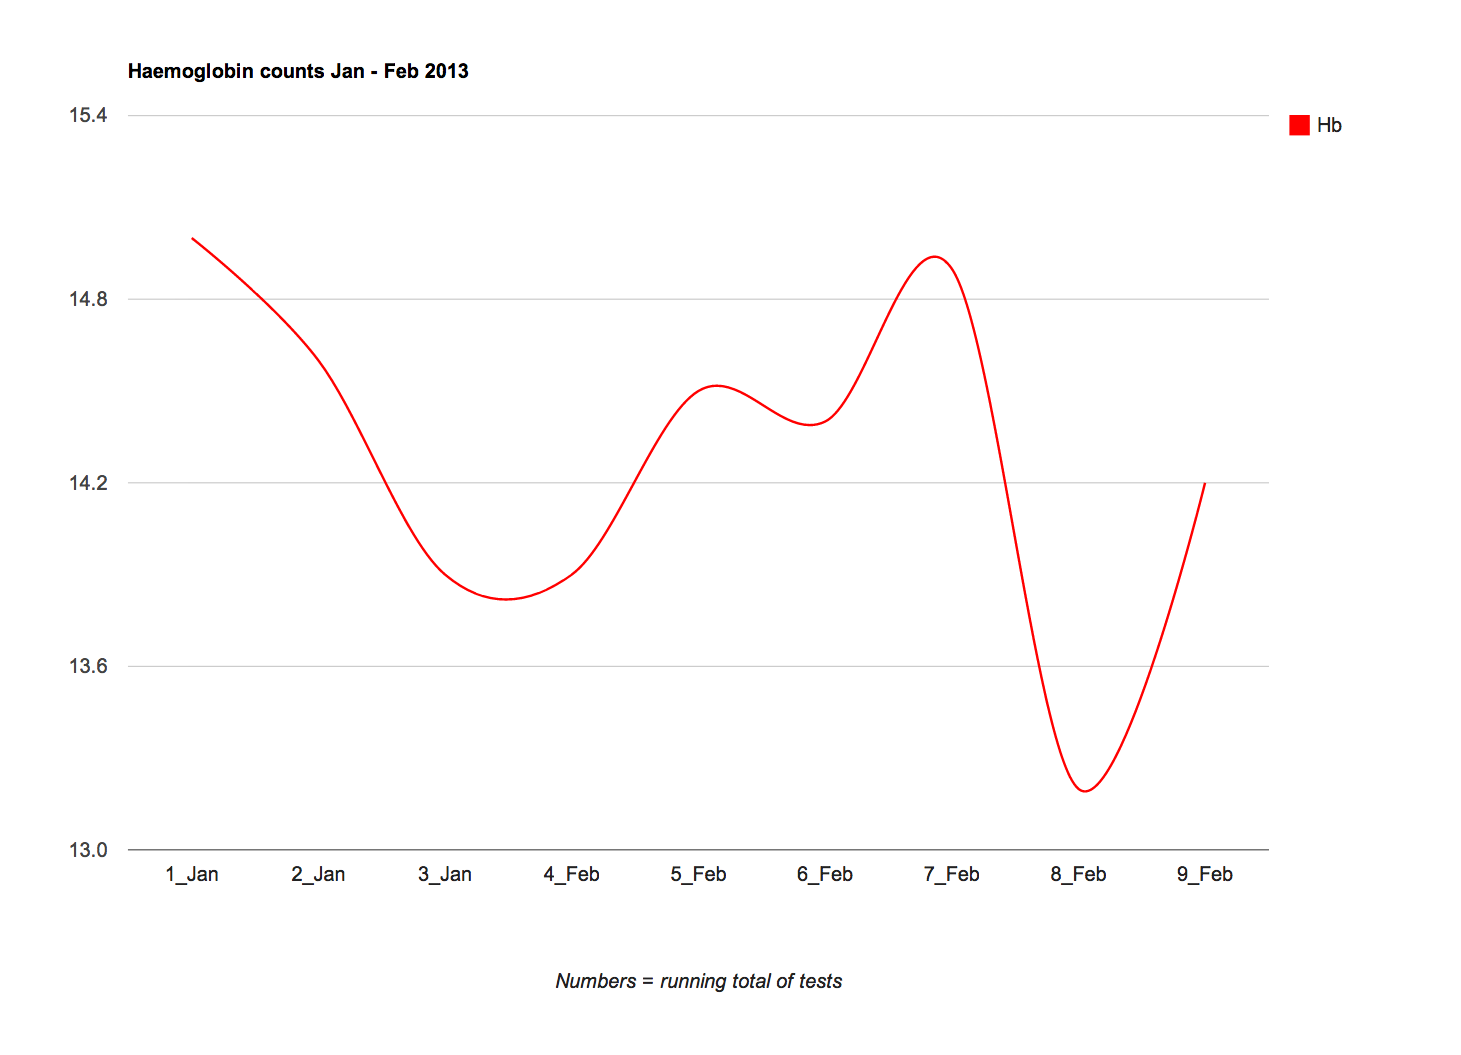
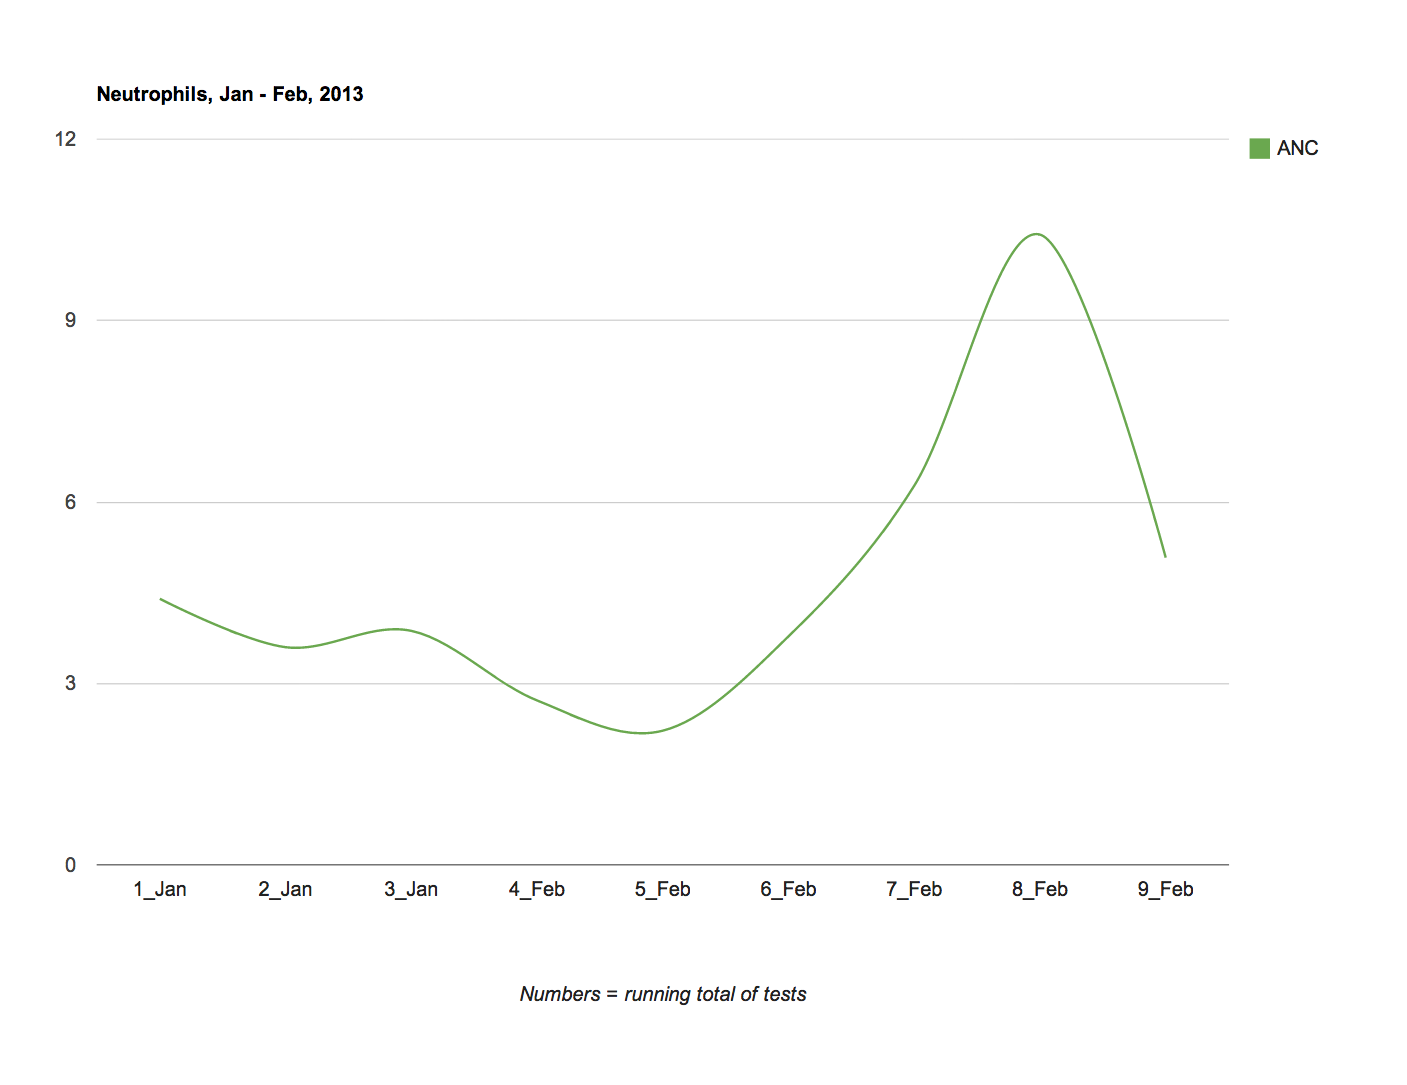
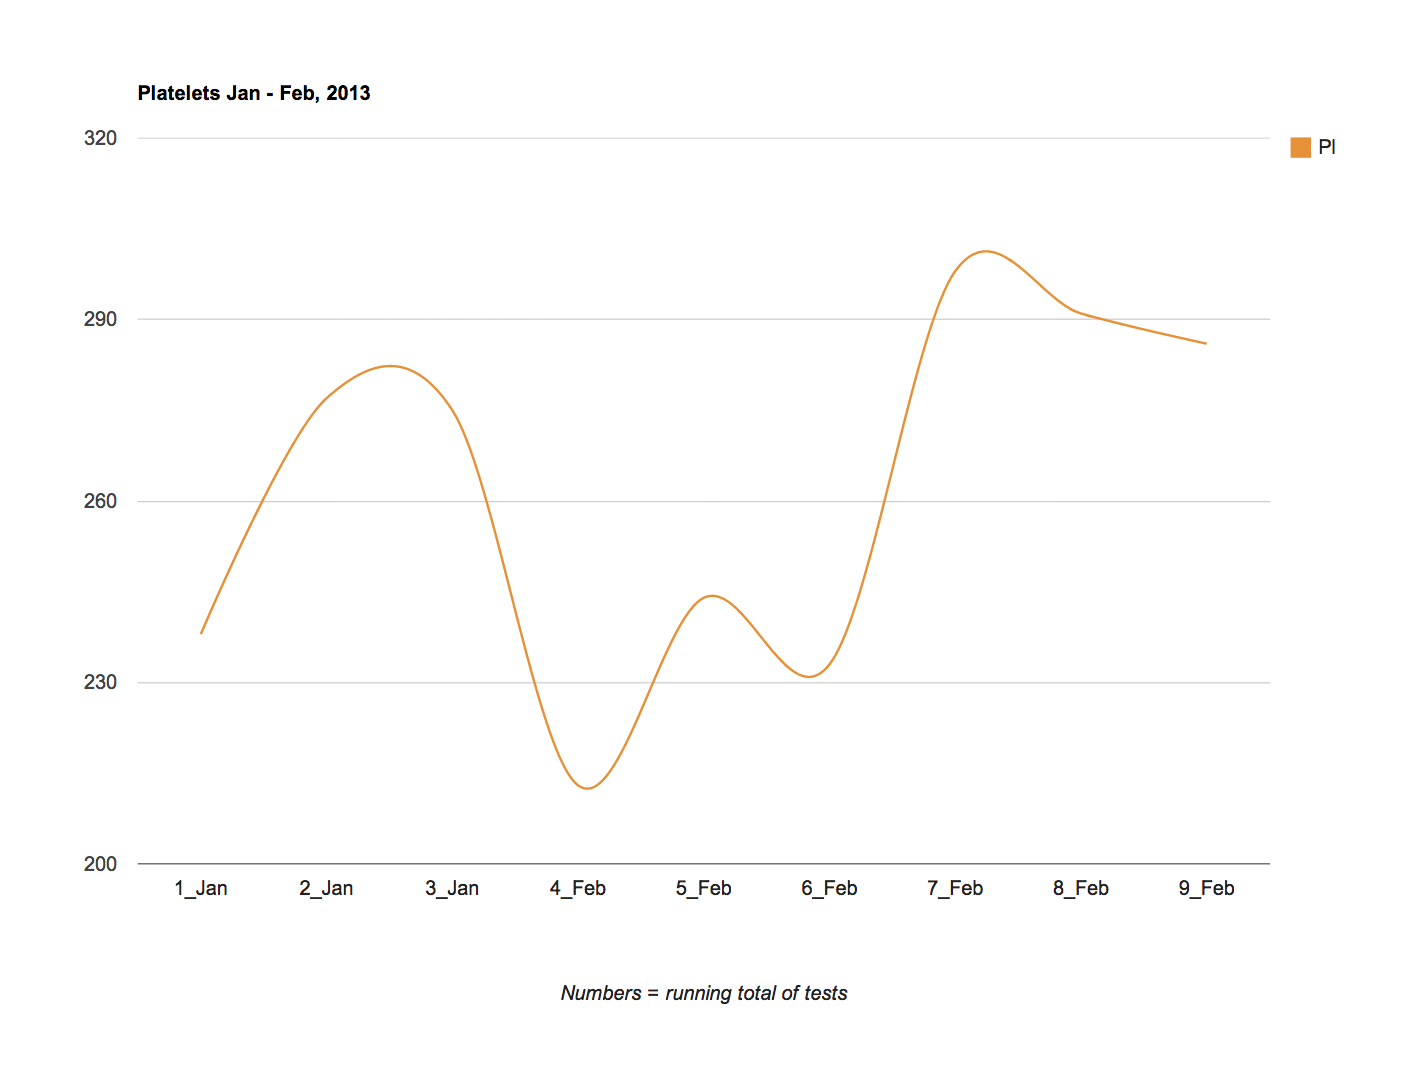
Bloods and discomfort analysis
A low of 2 and a high of 4 in the discomfort index. March starts just after the large light blue spike at the end of February. The pattern is relatively consistent but the dips do reflect the fact that I had a persistent eye infection (both eyes) in the latter part of the month. My bloods have all remained stable and in normal range. My immune system continued to function well. I’ve barely had a sniffle.
