Graphing control Jan-March 2013

control_march_graph

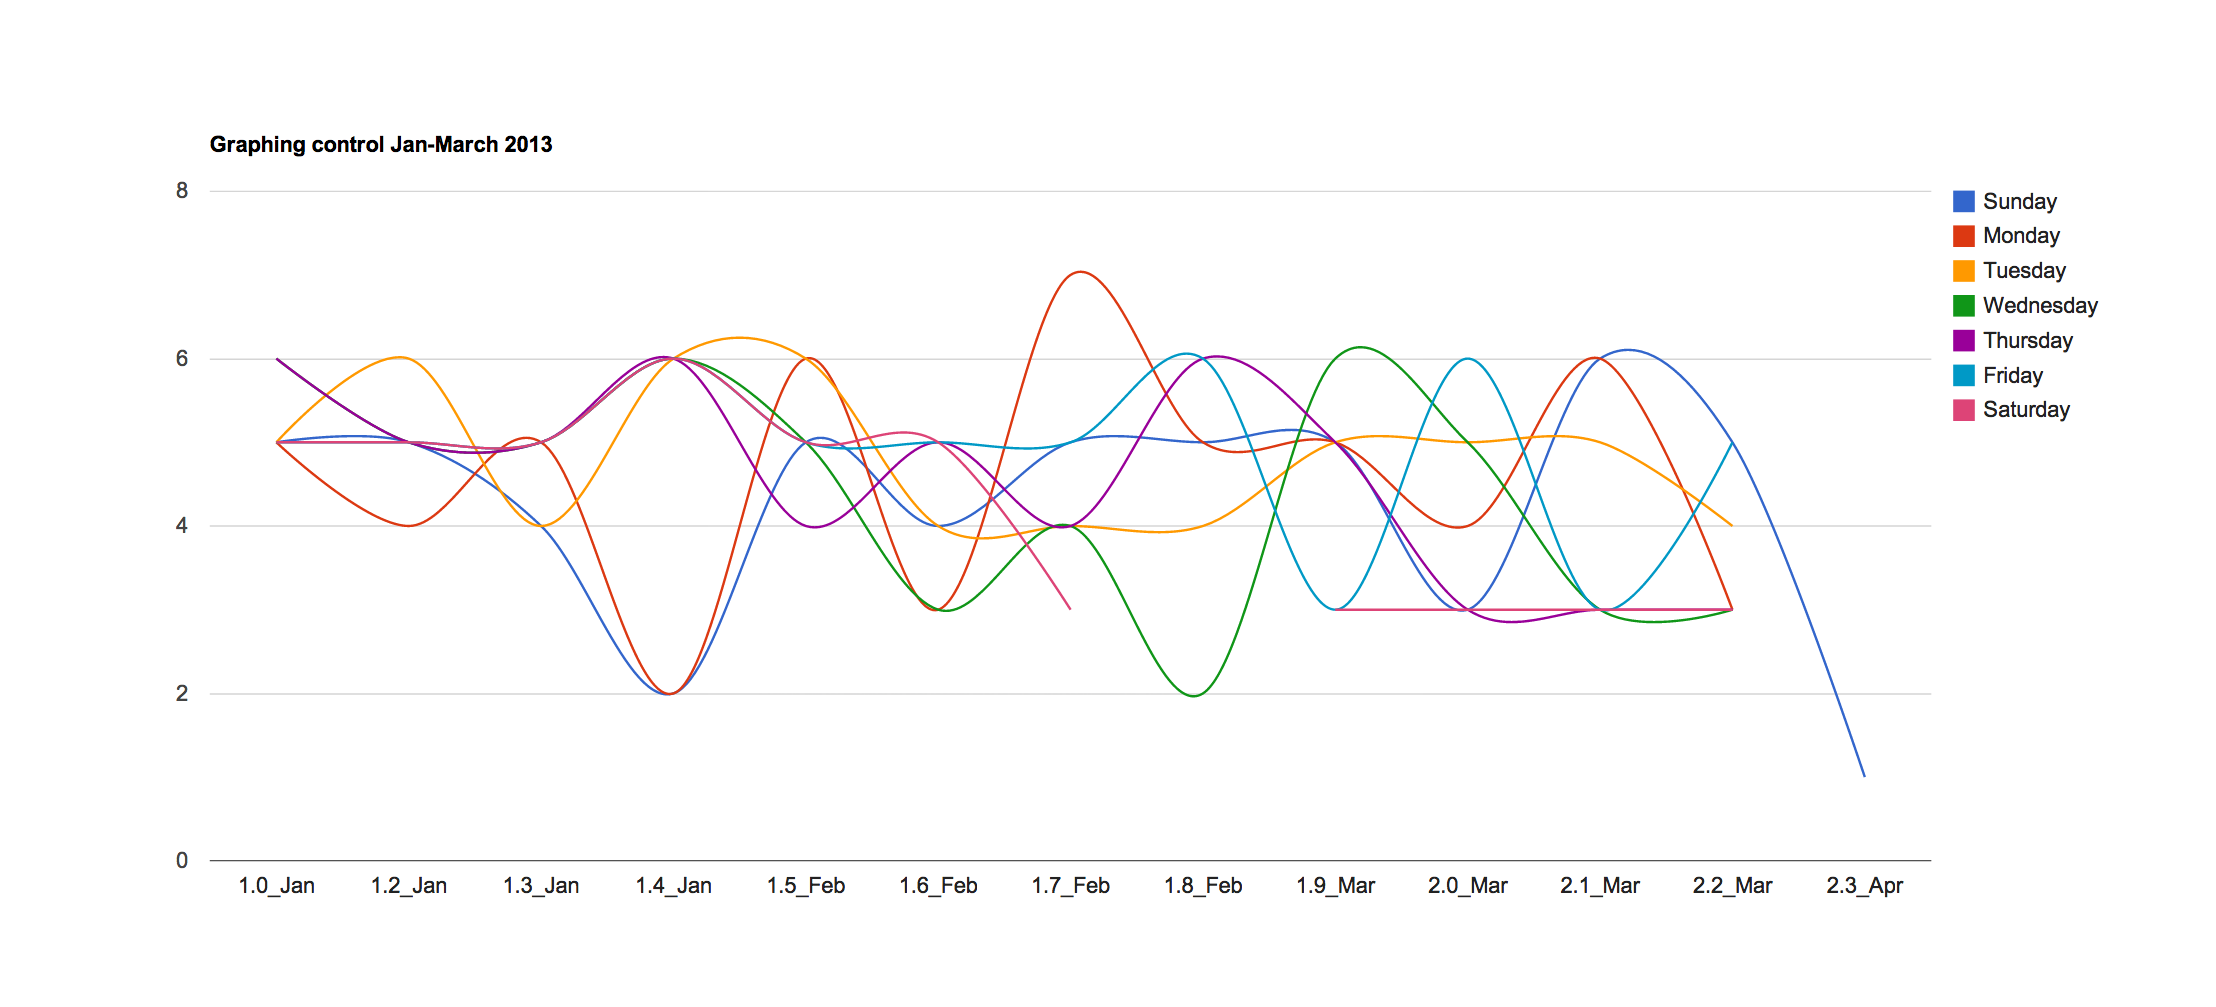
Weekly values as numbers  along the bottom, values on the Y axis.
You should be able to find an interactive version of the chart here

Key:
Complete controll = 9-10
A good deal of controll = 7-8
Some controll = 5-6
A little controll= 3-4
No control at all = 1-2

Leave a Reply

Fill in your details below or click an icon to log in:

WordPress.com Logo

You are commenting using your WordPress.com account. Log Out /  Change )

Facebook photo

You are commenting using your Facebook account. Log Out /  Change )

Connecting to %s

%d bloggers like this: