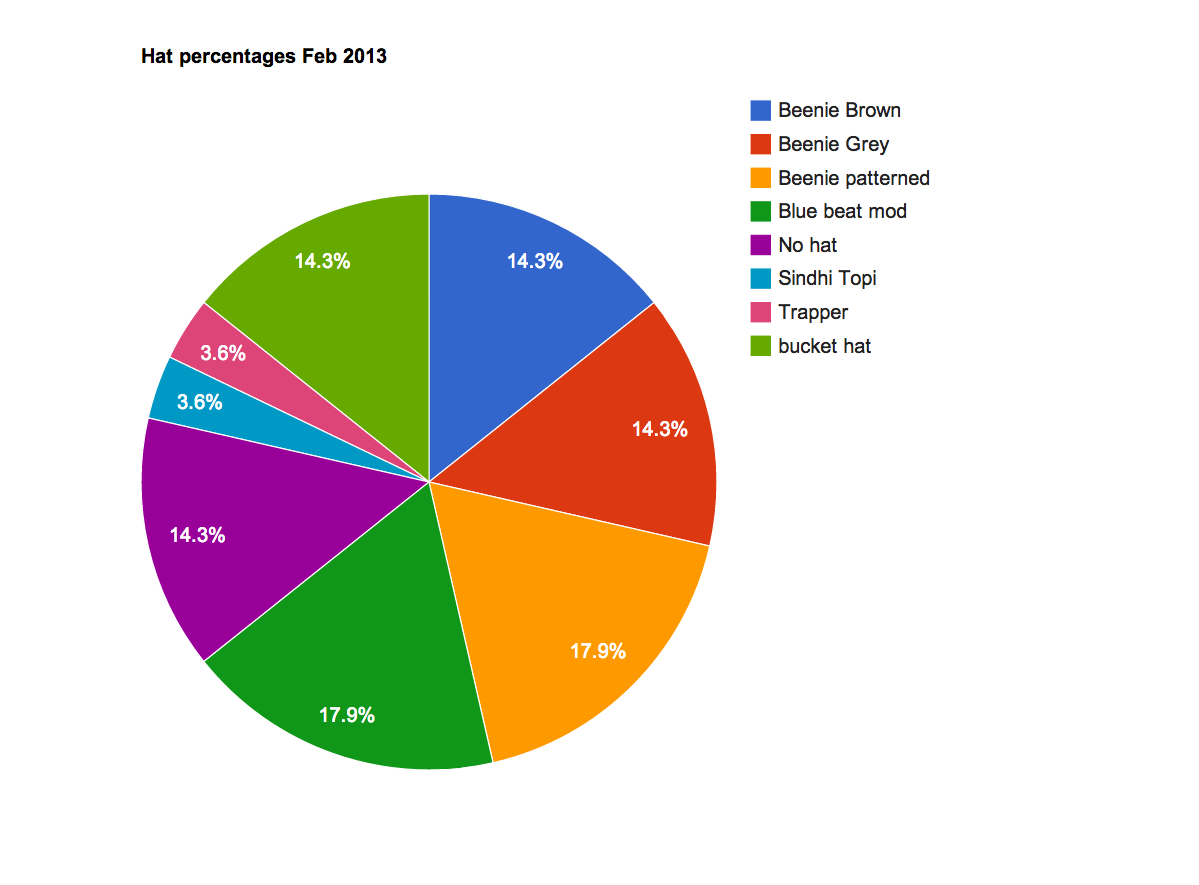
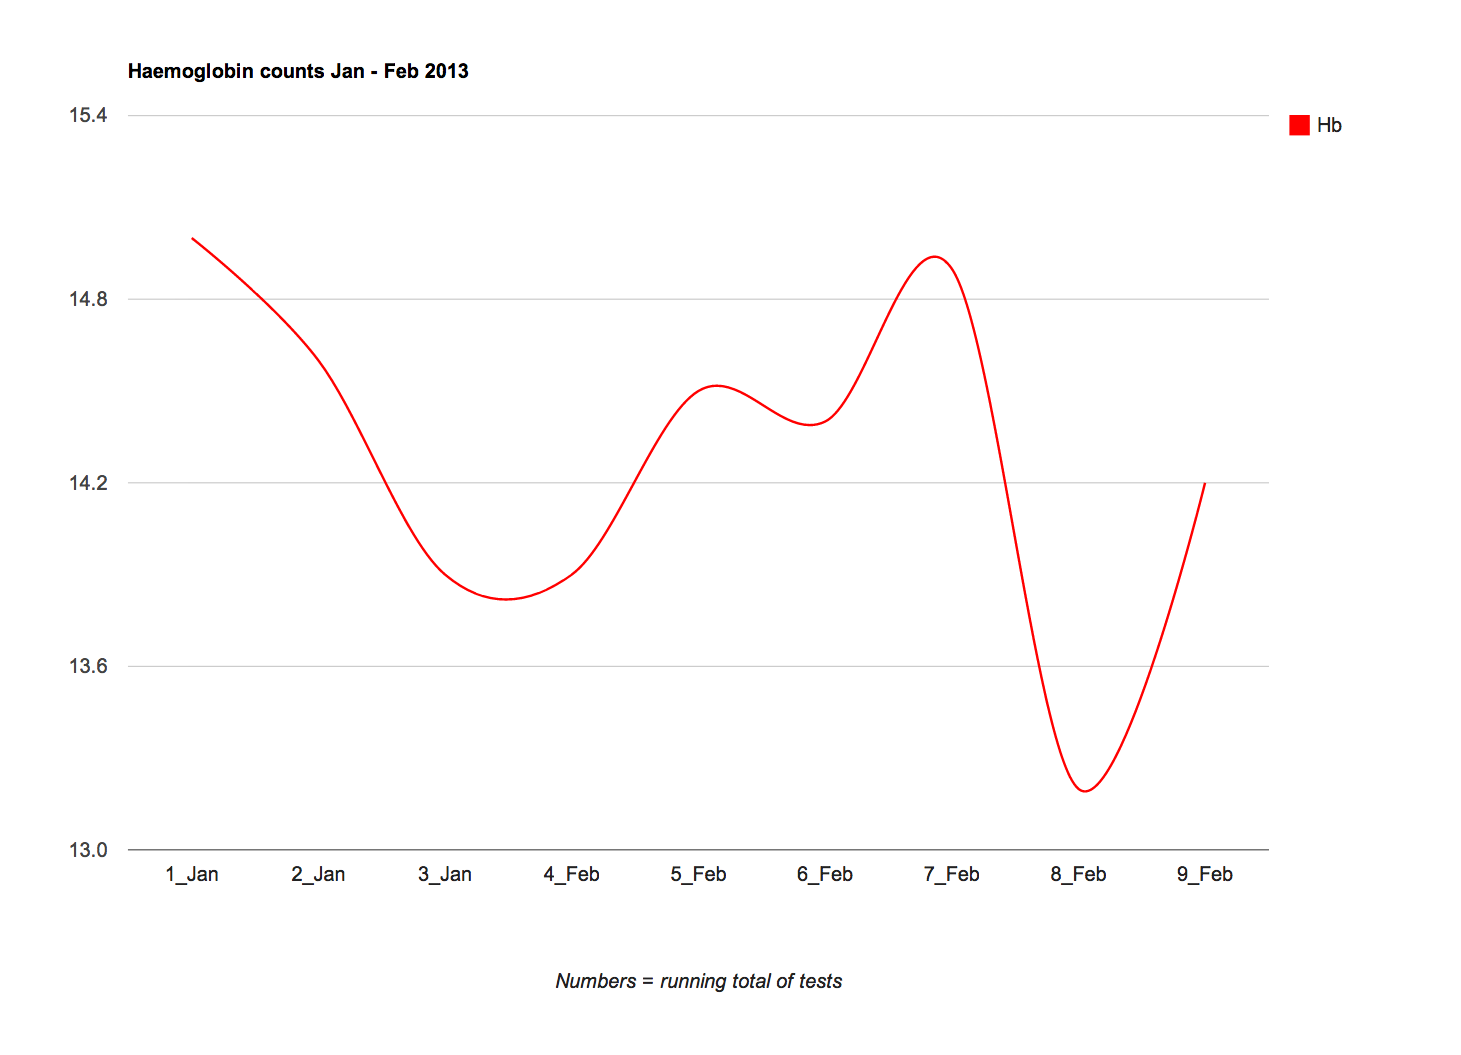
Graphs
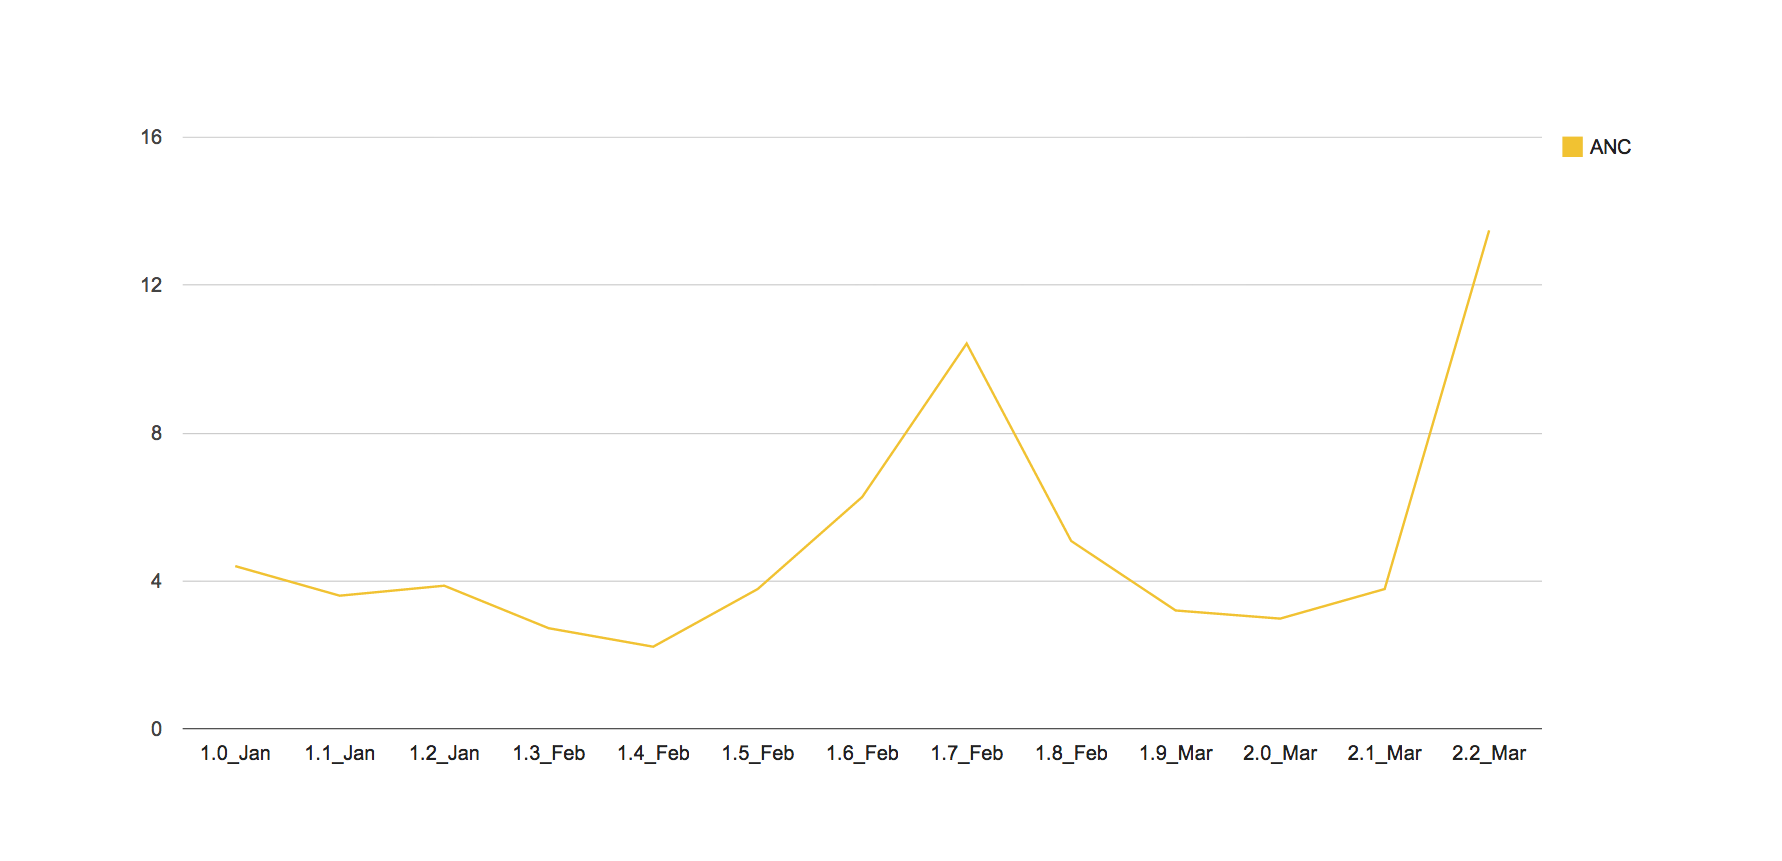
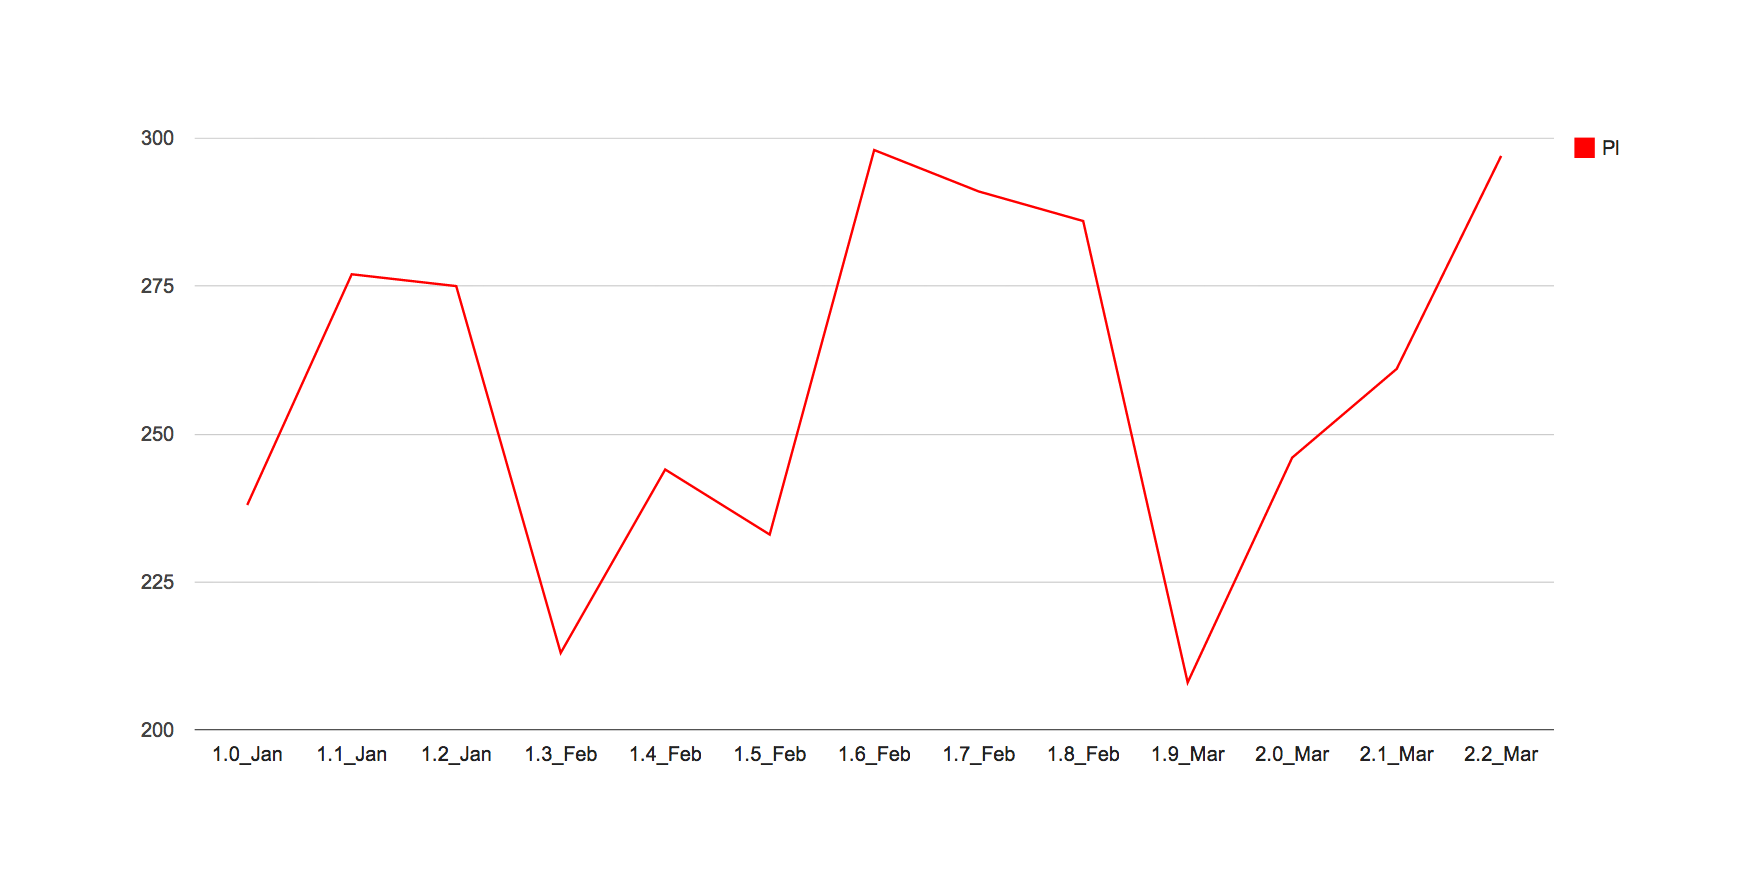

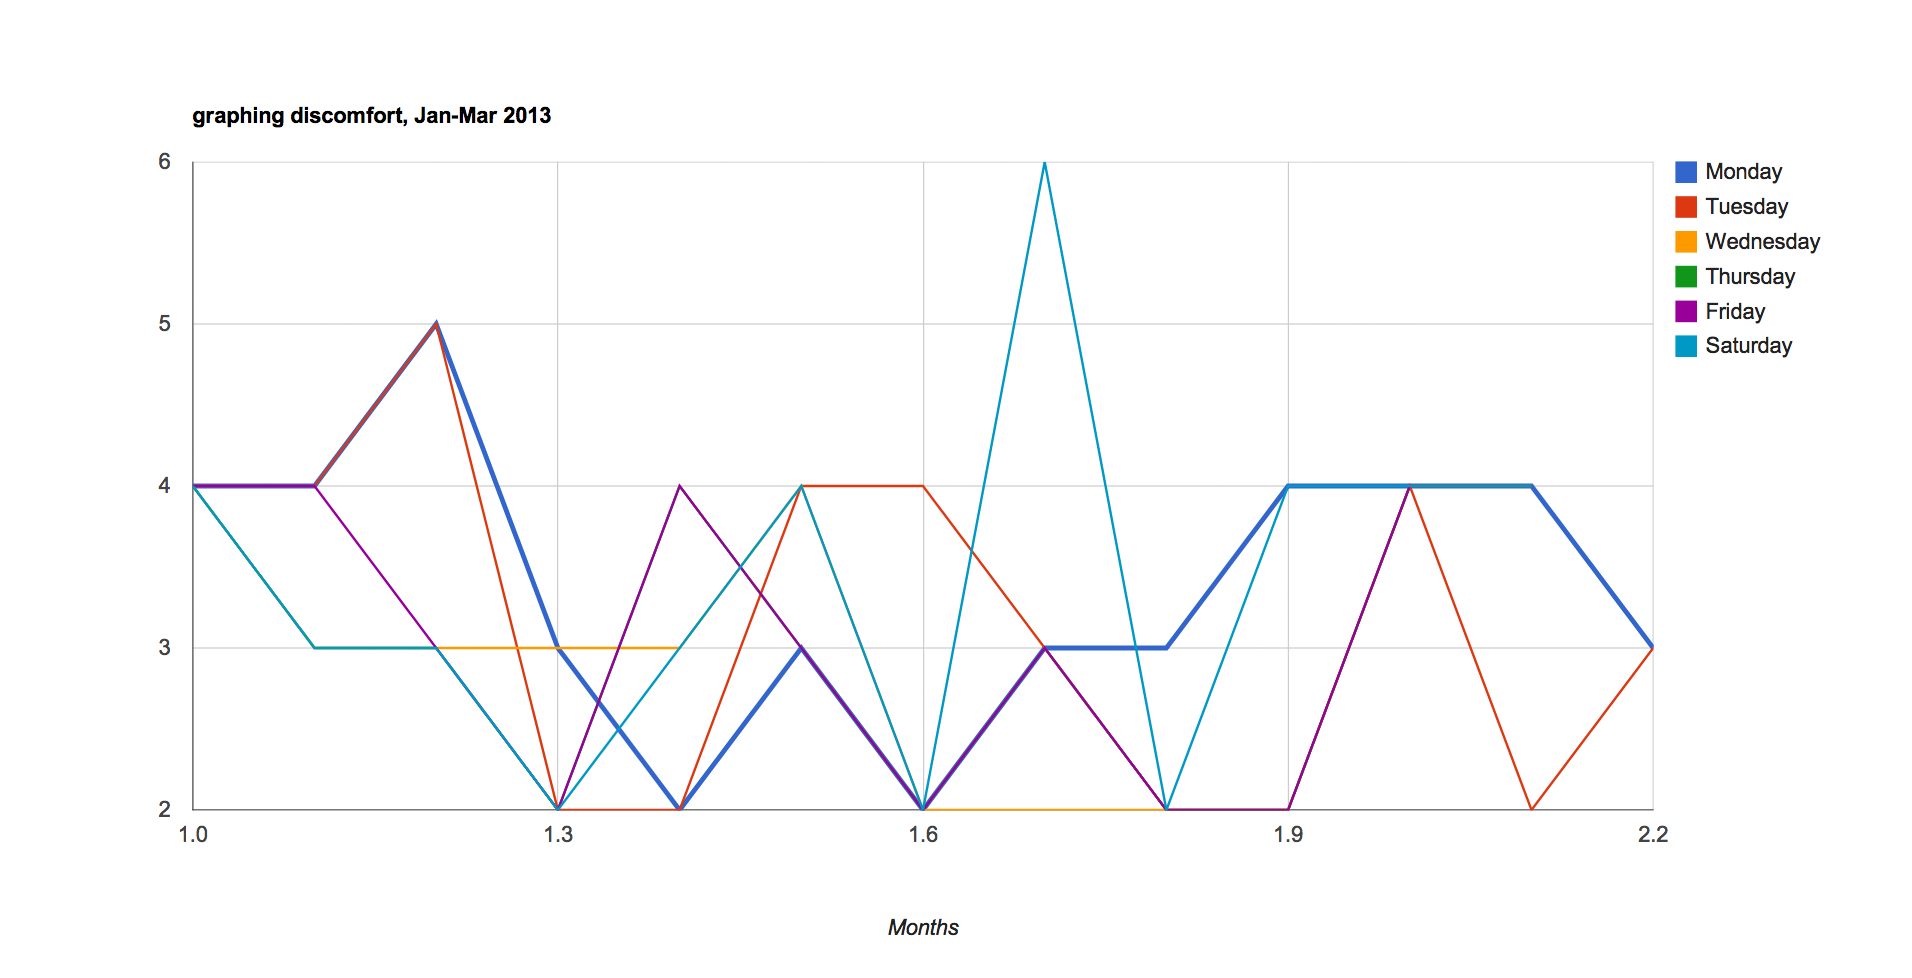
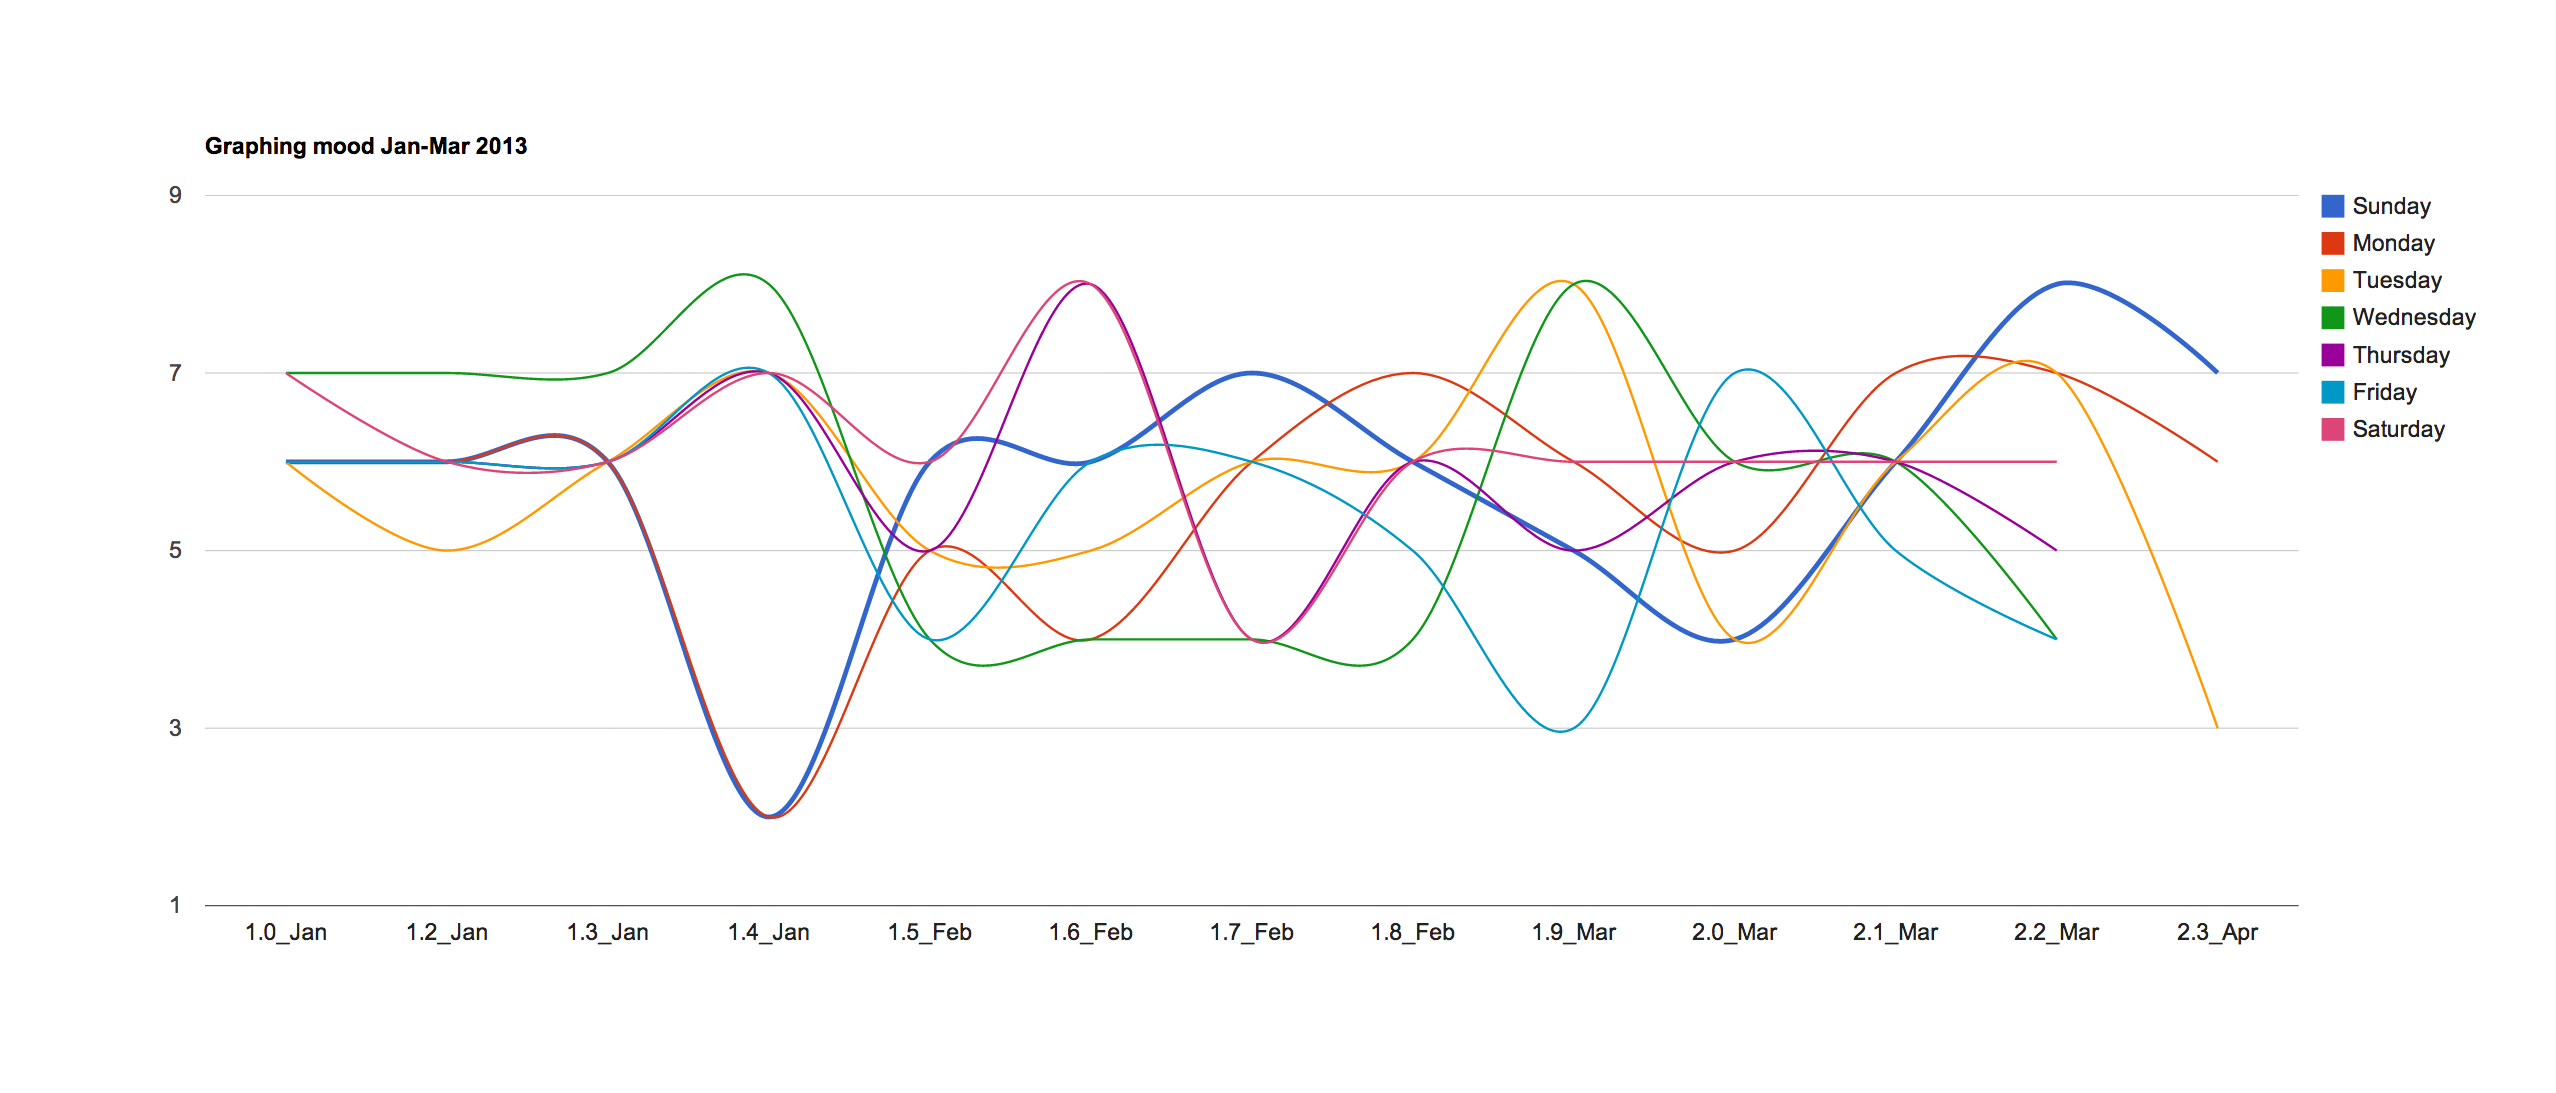
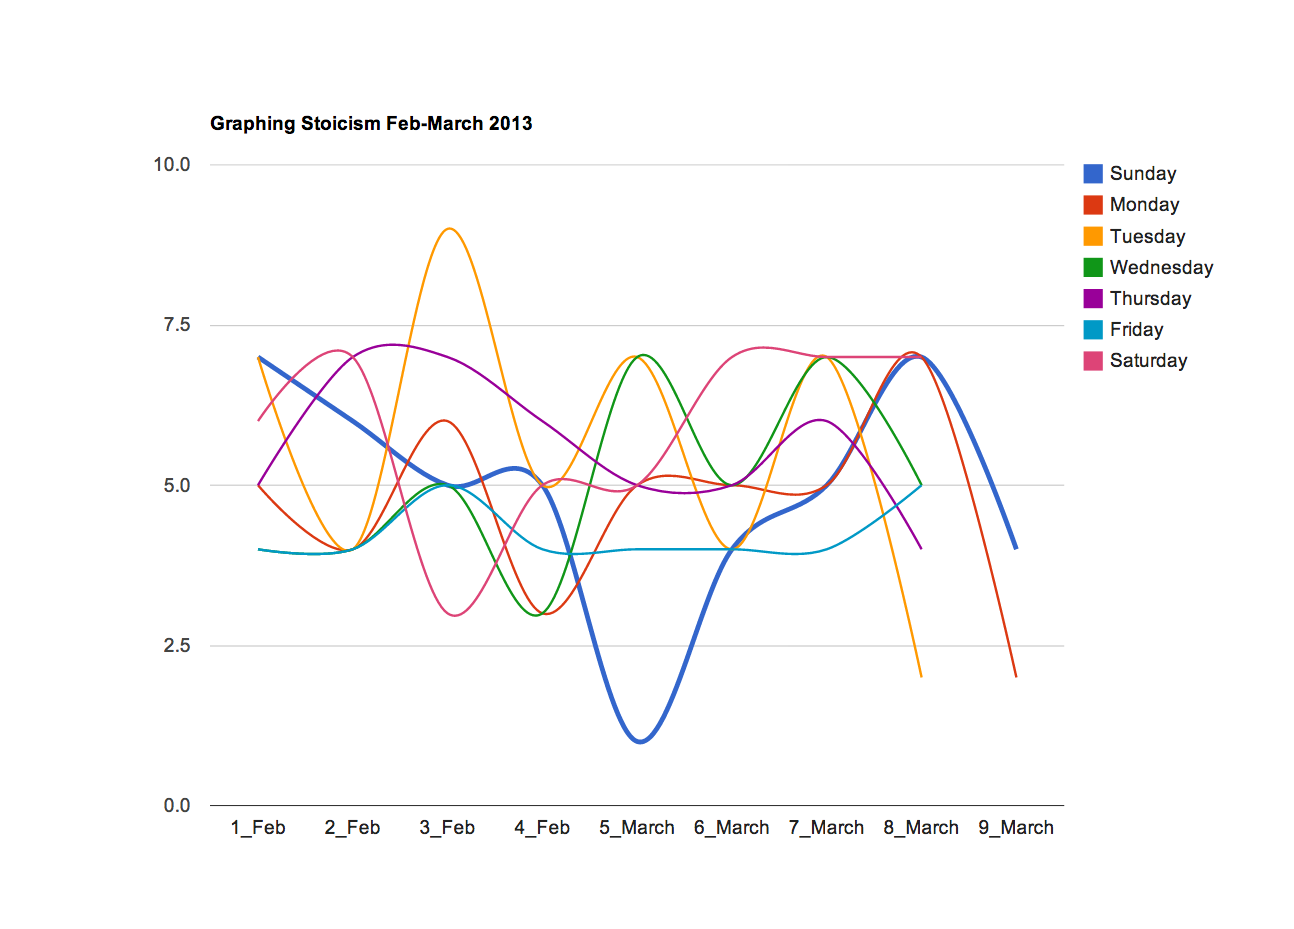
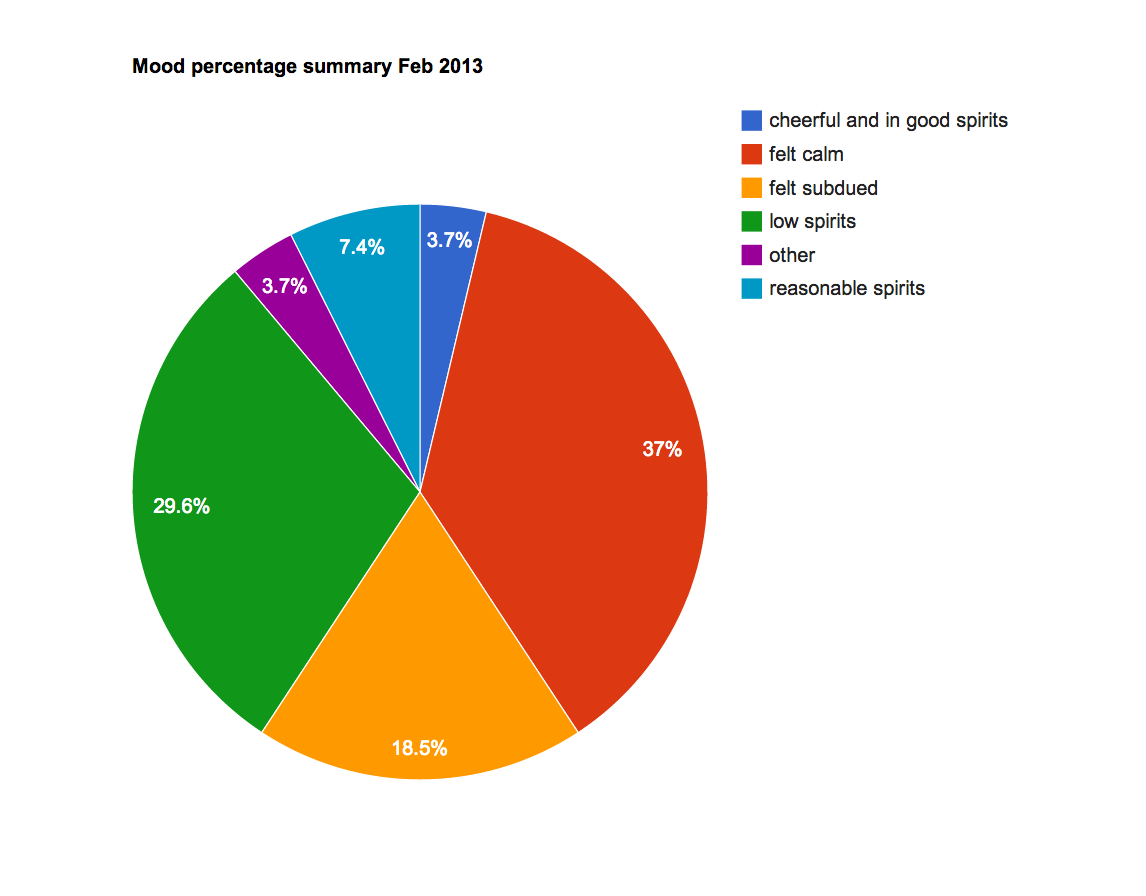
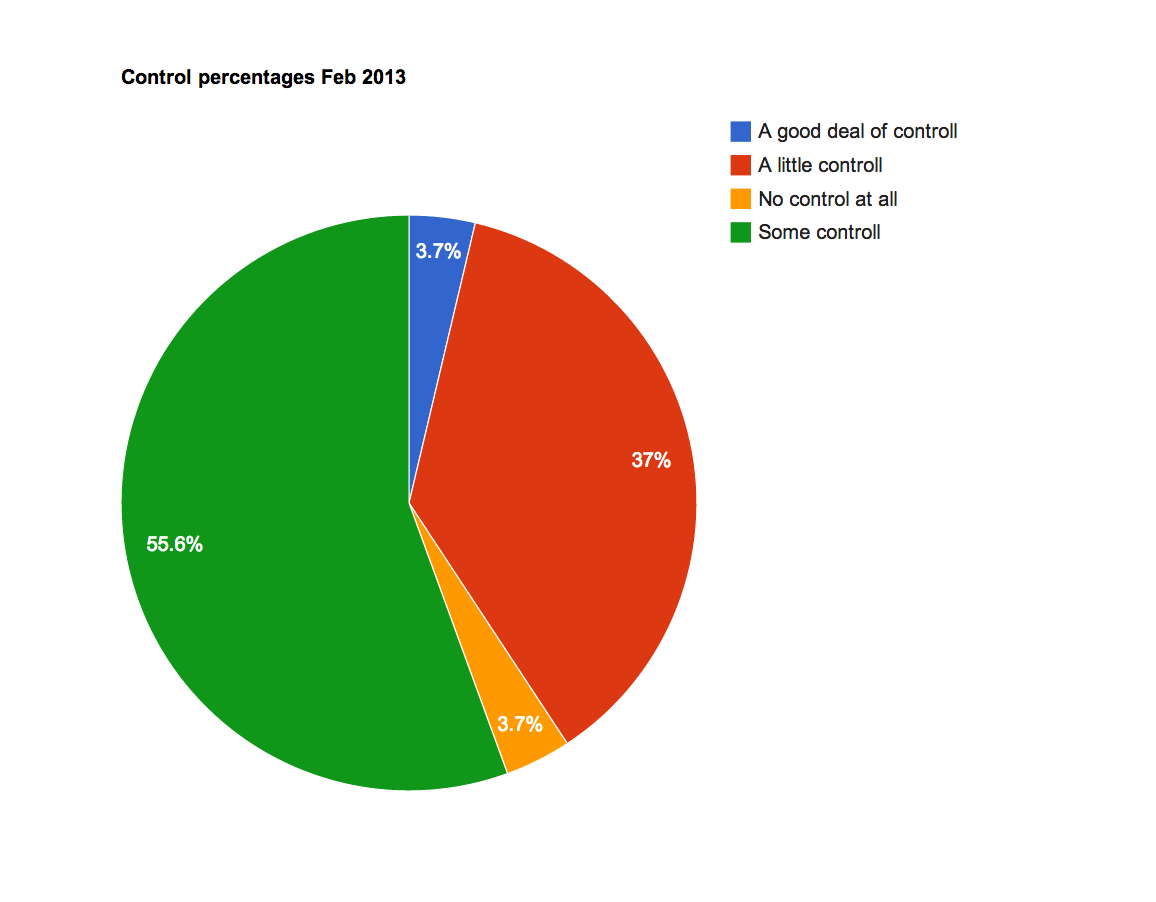
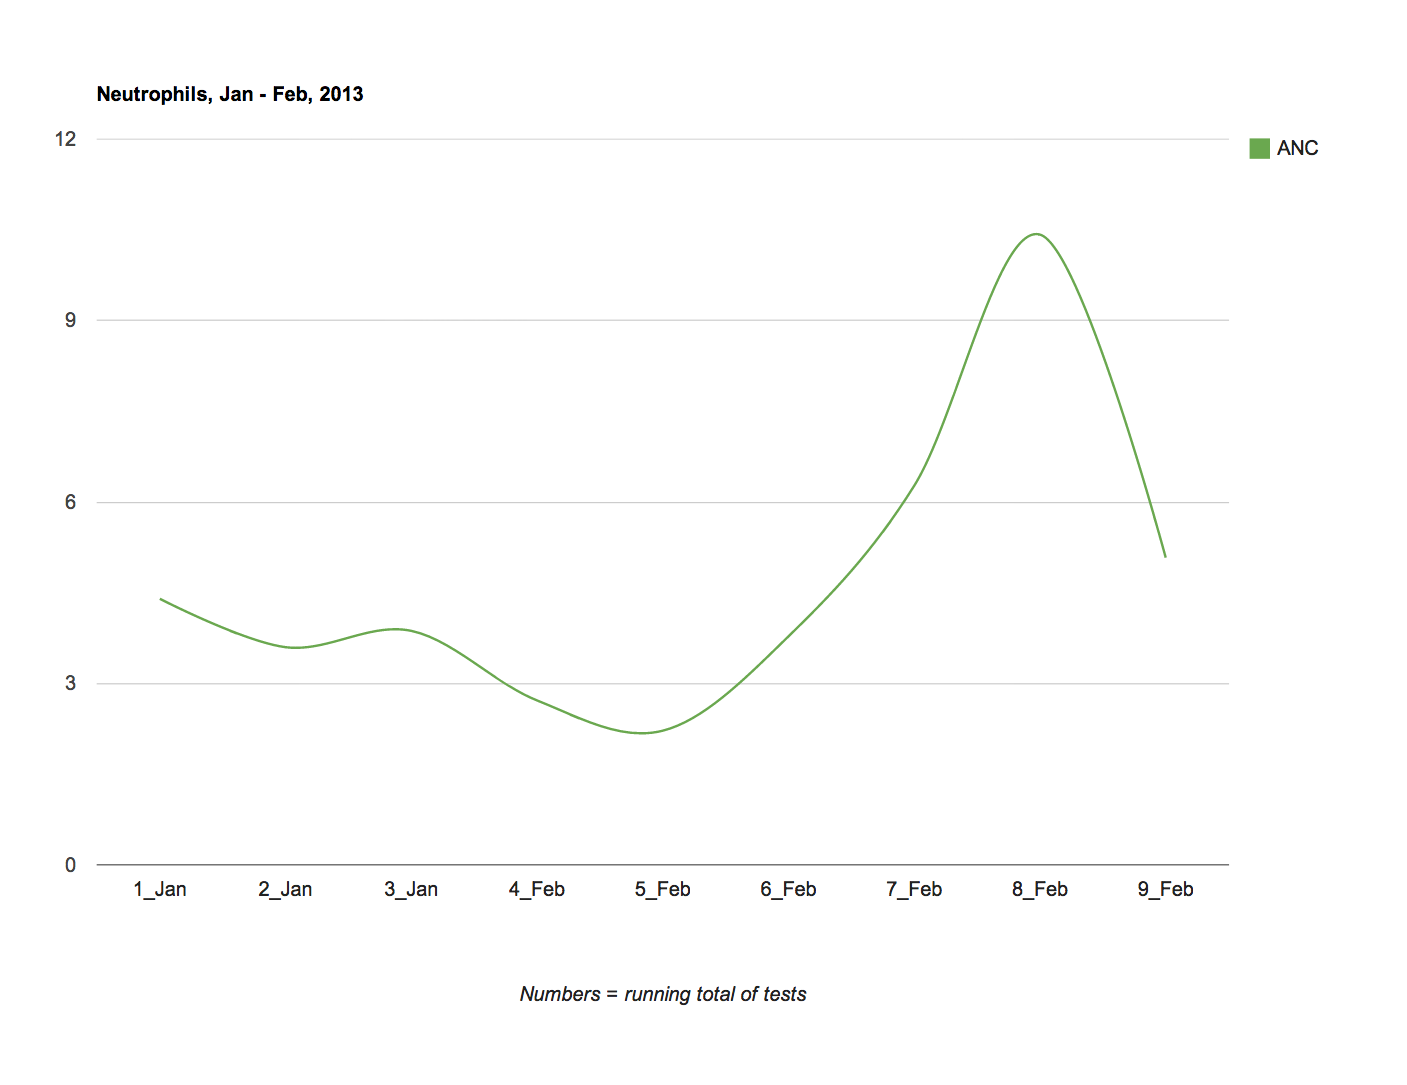
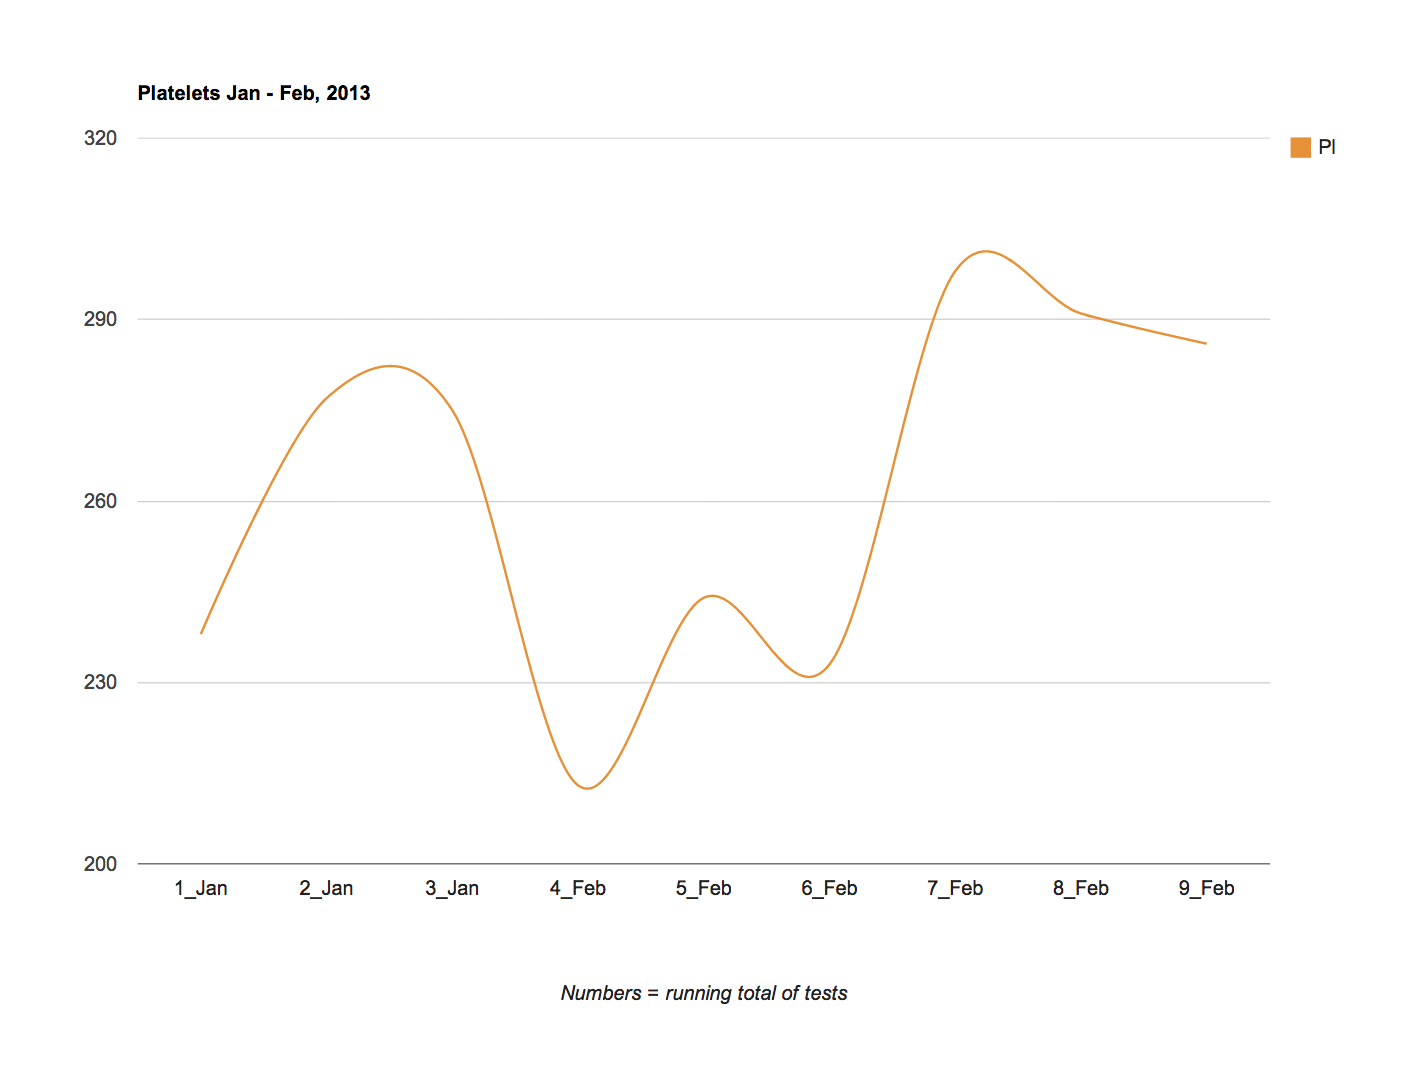
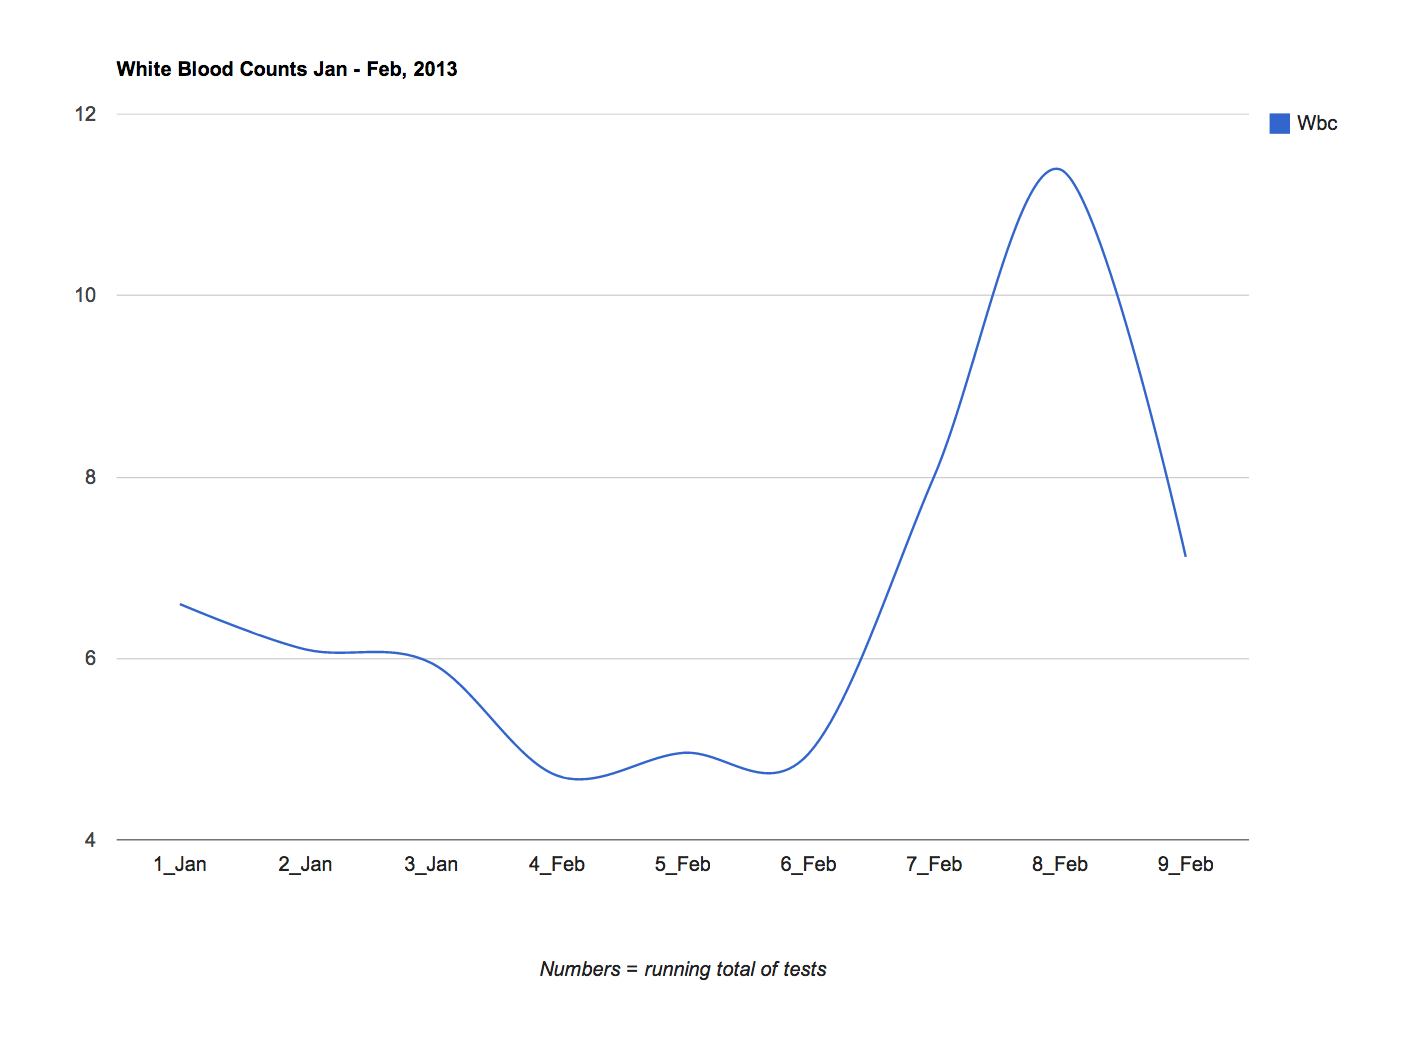
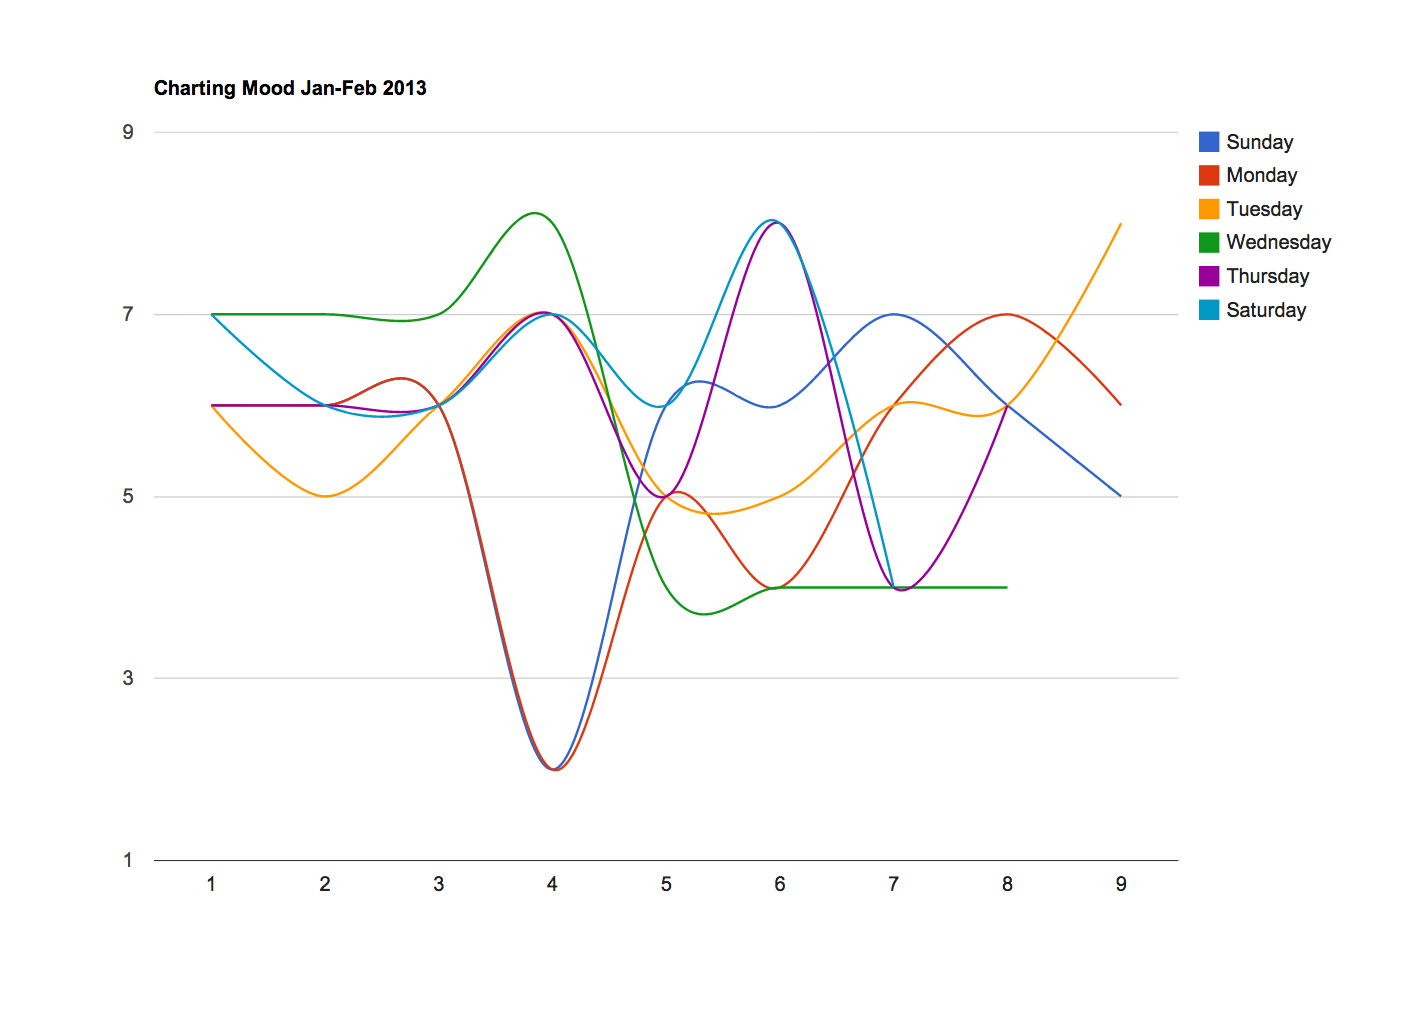
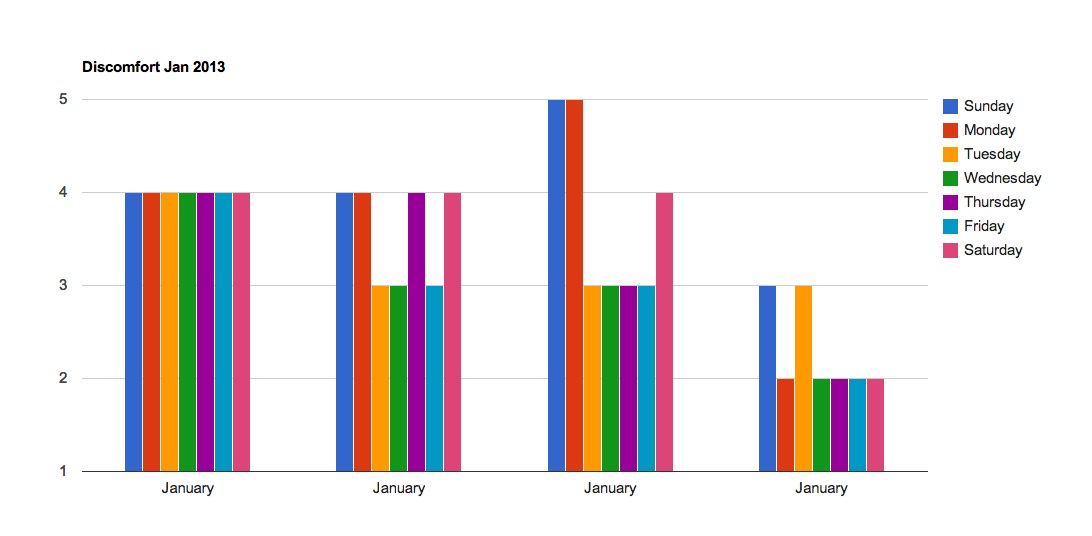
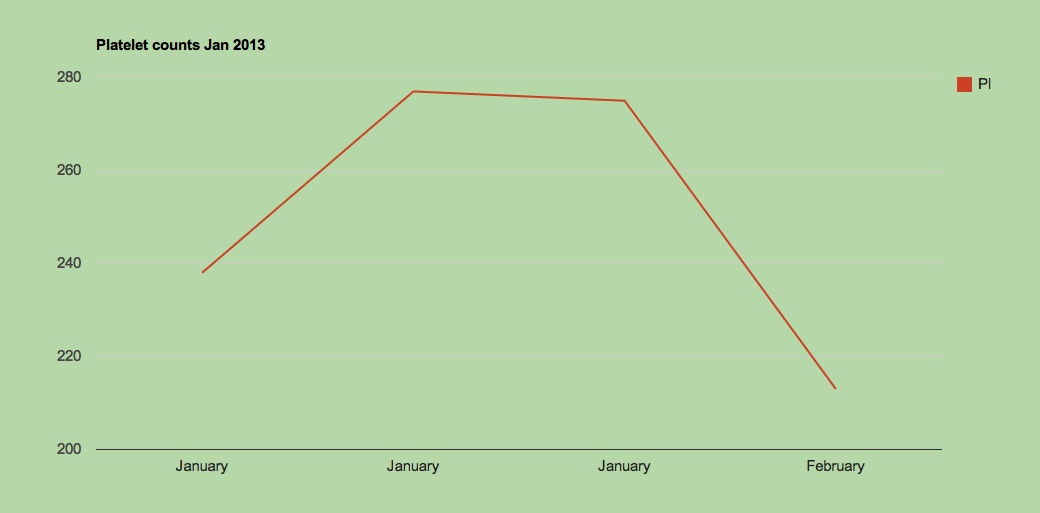
Weeks starting along the bottom, values up the right.
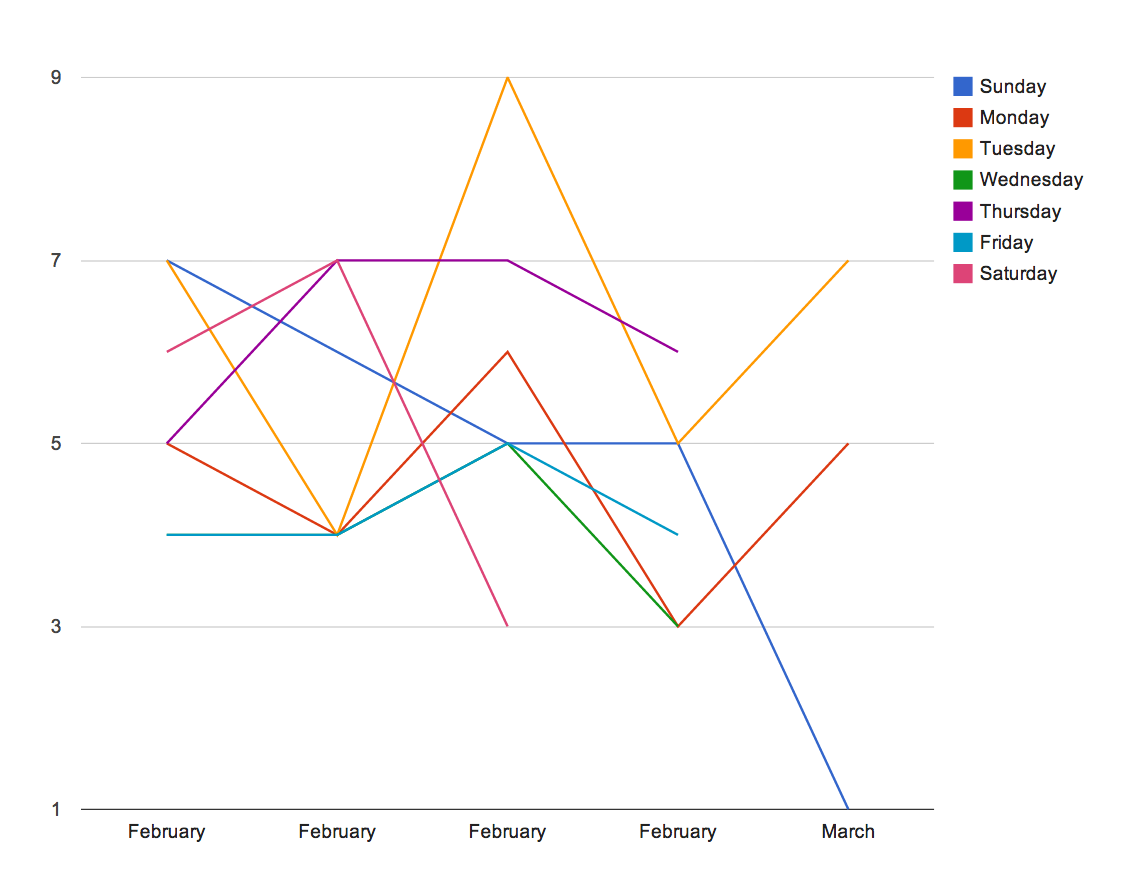
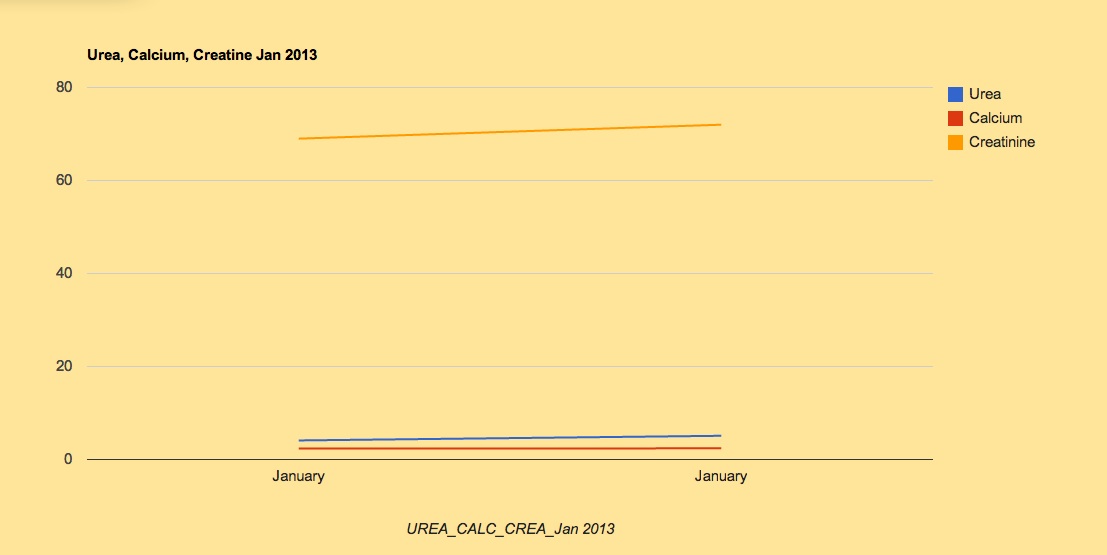
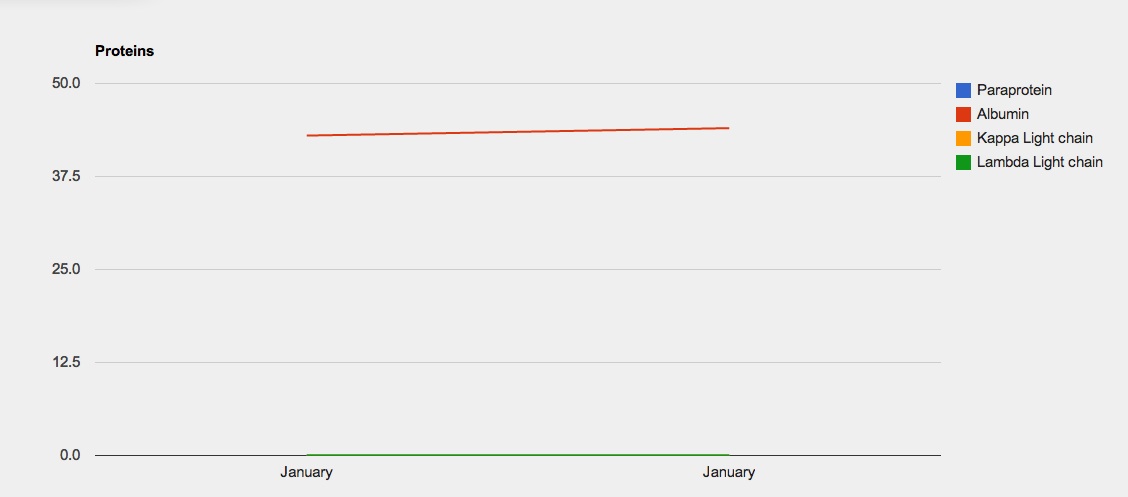
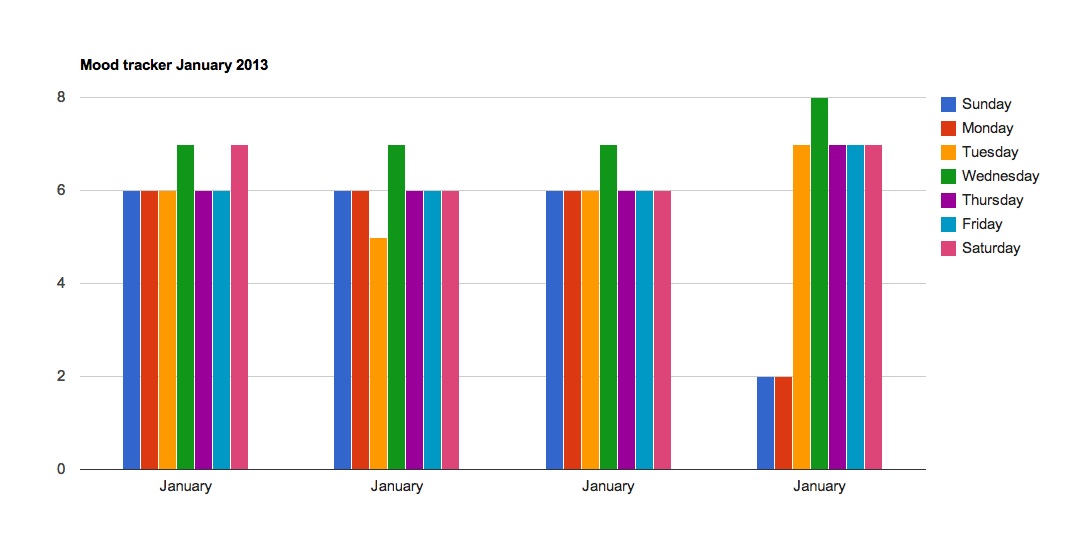
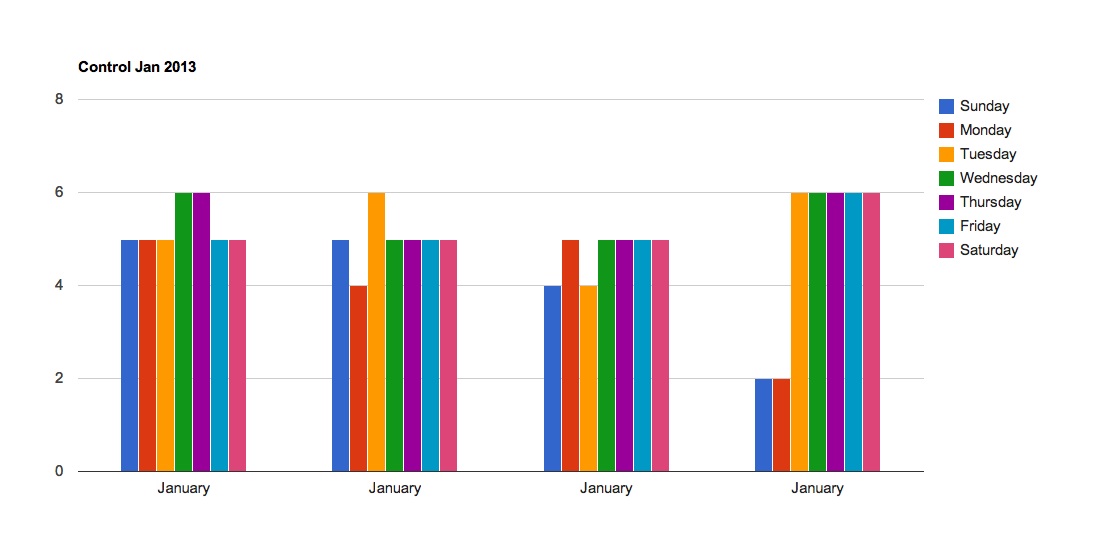
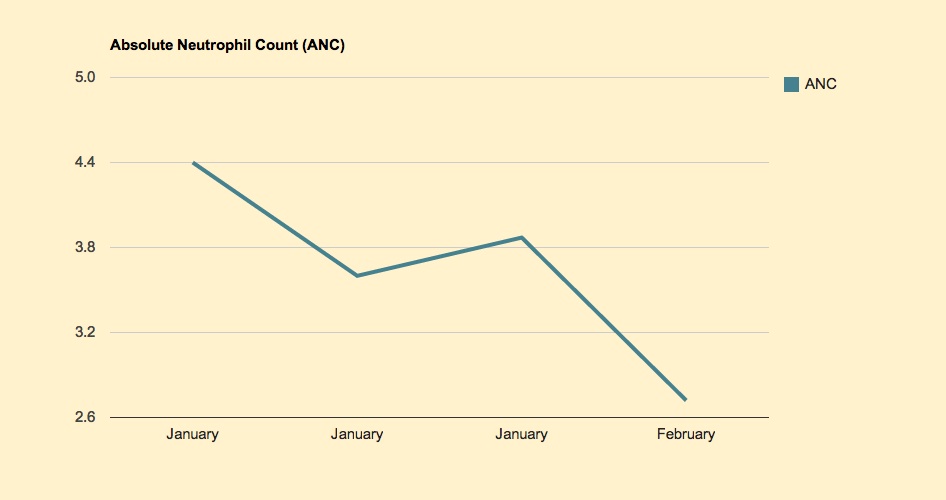
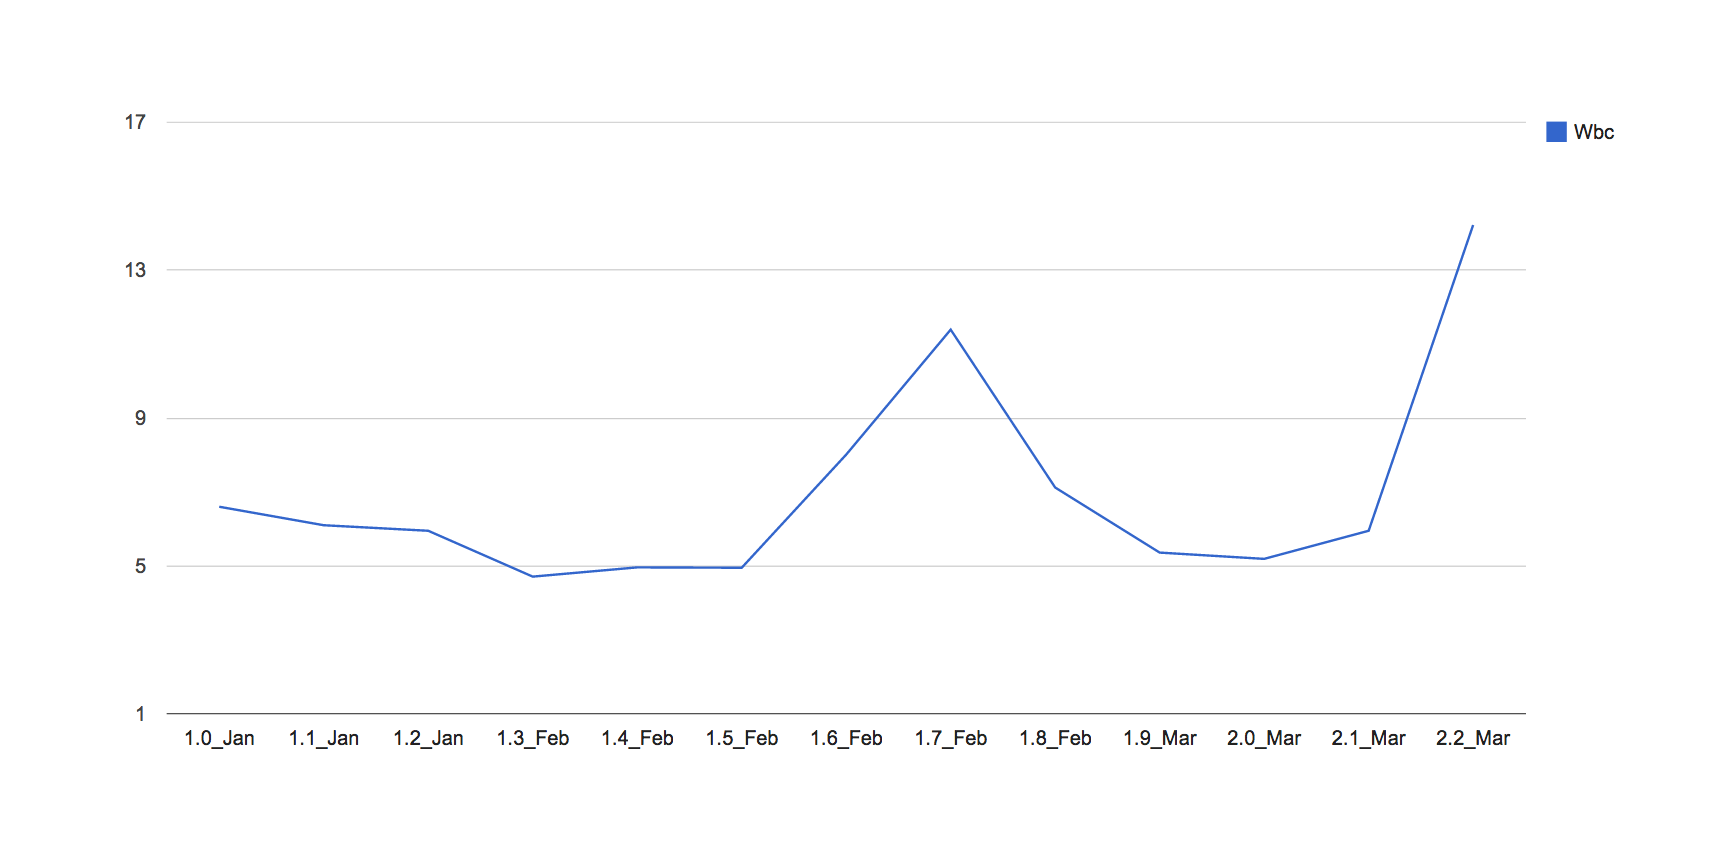
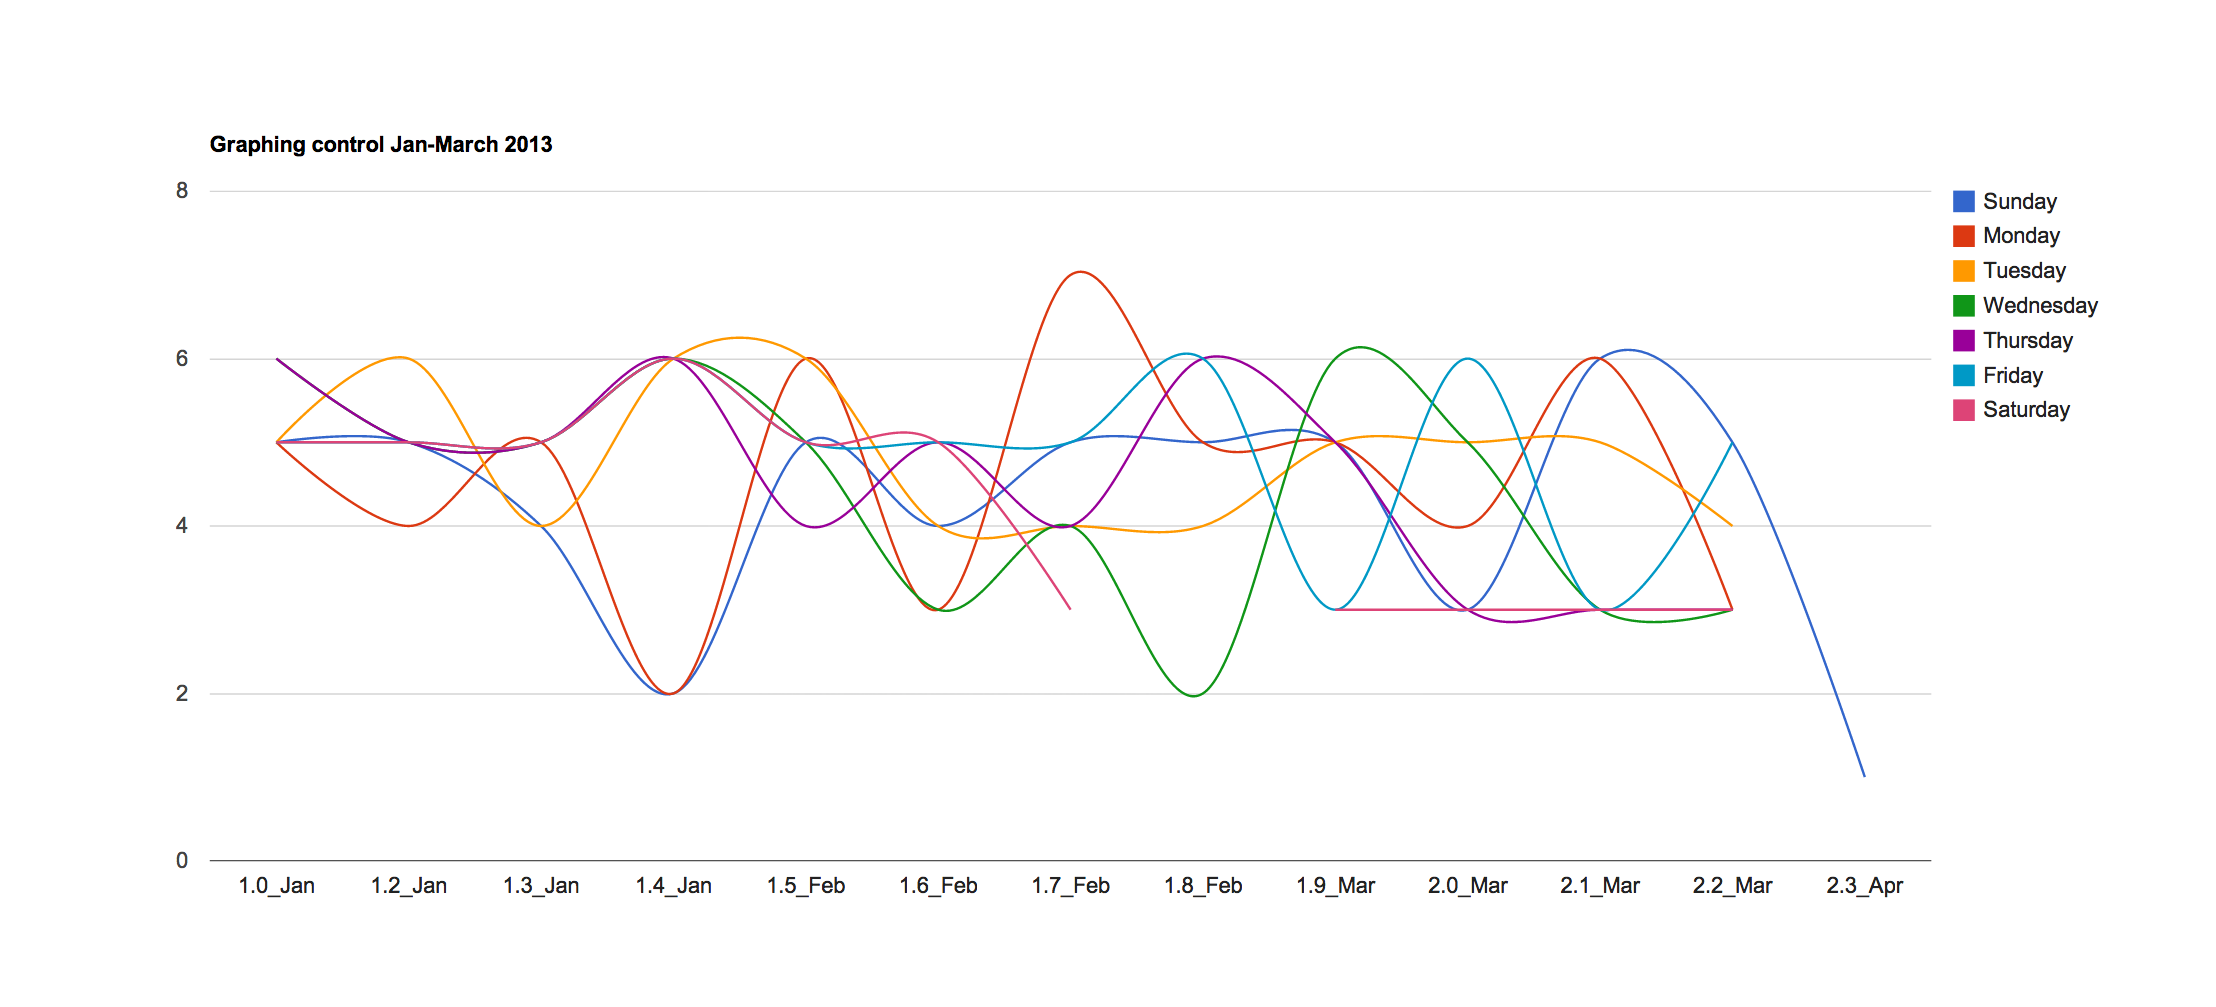
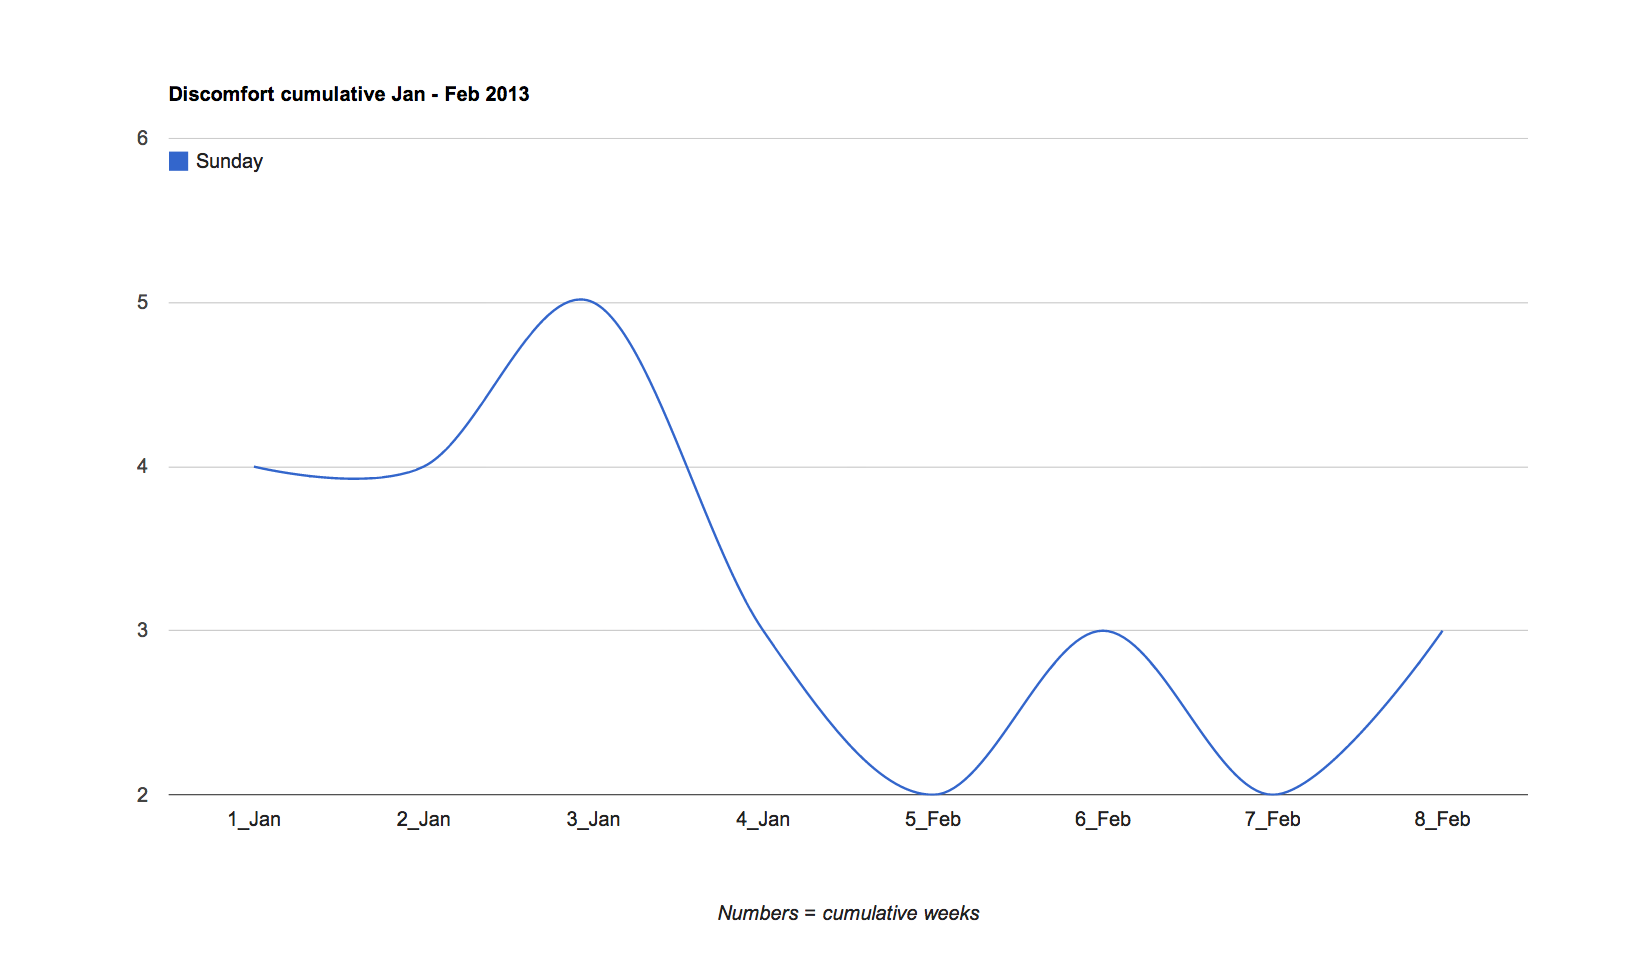
Weeks starting along the bottom, values up the right.
blood and bones. RSS feed. Blog at WordPress.com.
