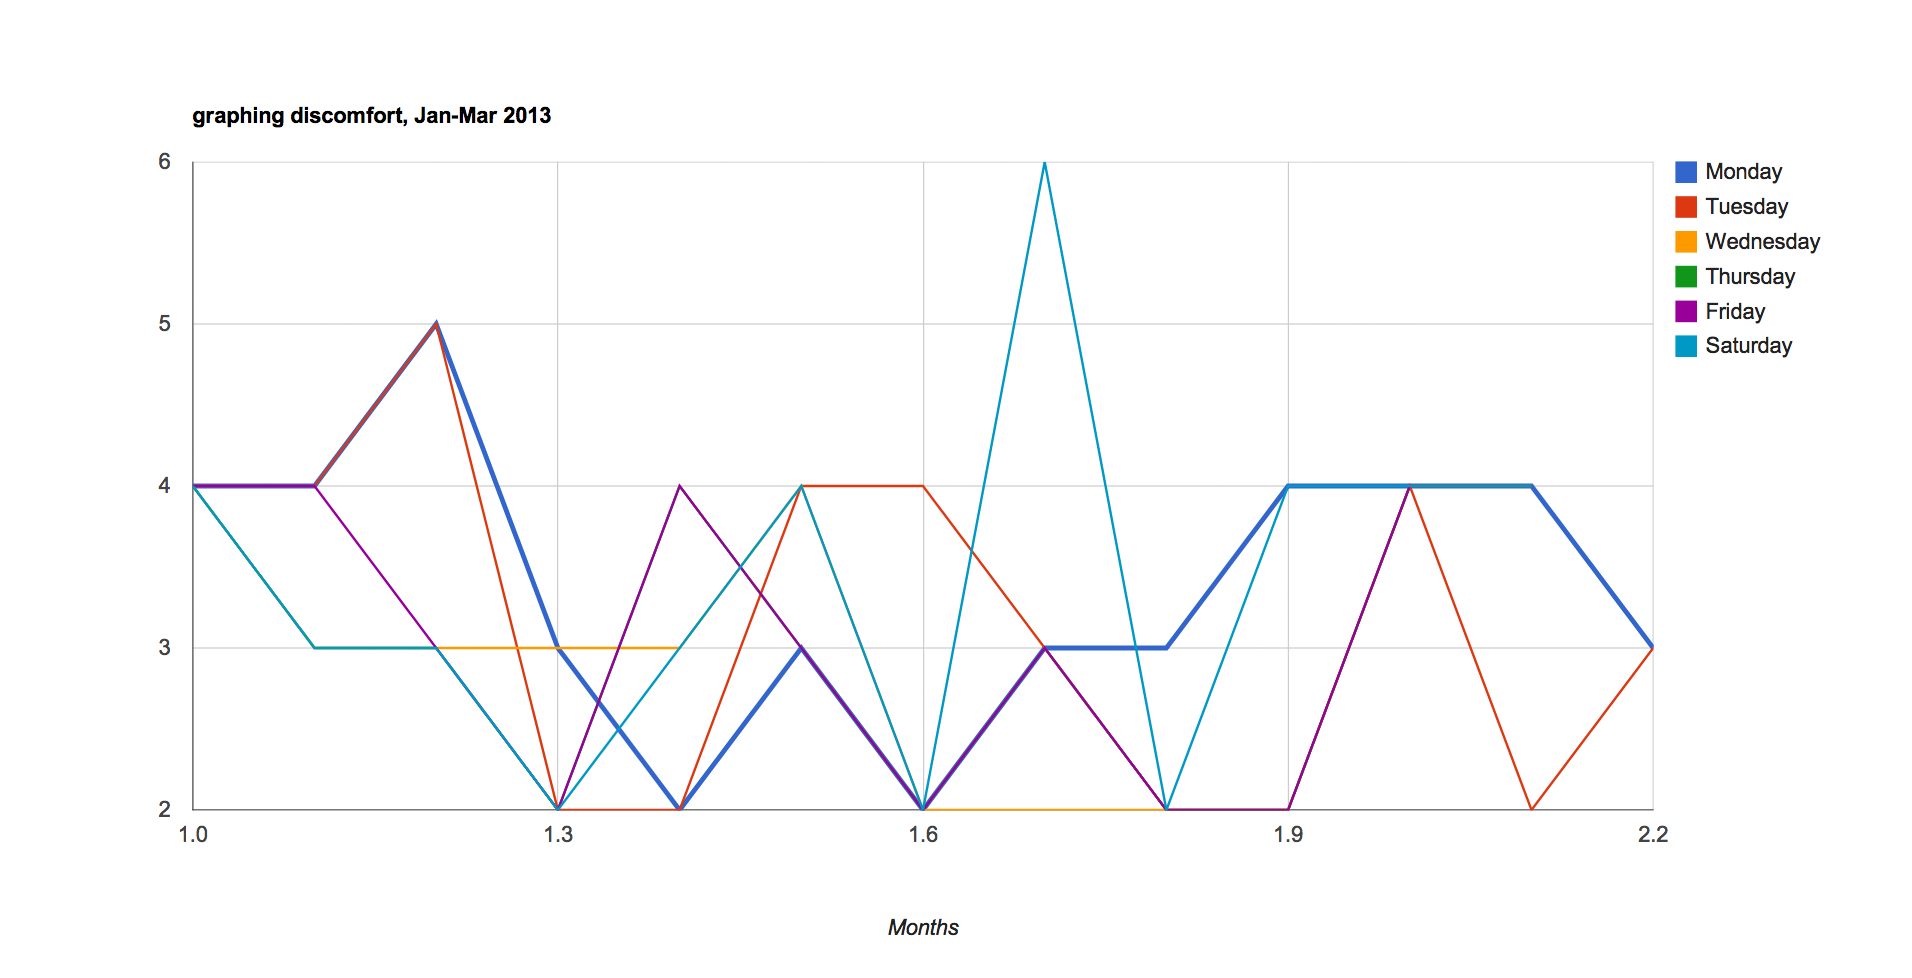
Weekly values as numbers along the bottom, values on the Y axis.
You should be able to find an interactive version of the chart here
Key:
0= none,
2= mild,
4 = moderate,
8= severe,
10 = worst possible
Weekly values as numbers along the bottom, values on the Y axis.
You should be able to find an interactive version of the chart here
Key:
0= none,
2= mild,
4 = moderate,
8= severe,
10 = worst possible
For detailed description of parameters see the Data Methods part of this website
Stoicism: Wobbly lip: 2
Mood: low spirits ≈ 4
Control: A little controll= 3
Discomfort: Mild = 2
For detailed description of parameters see the Data Methods part of this website
Stoicism: Grin and bare it = 5
Mood: low spirits ≈ 4
Control: A little controll= 3
Discomfort: Mild = 2
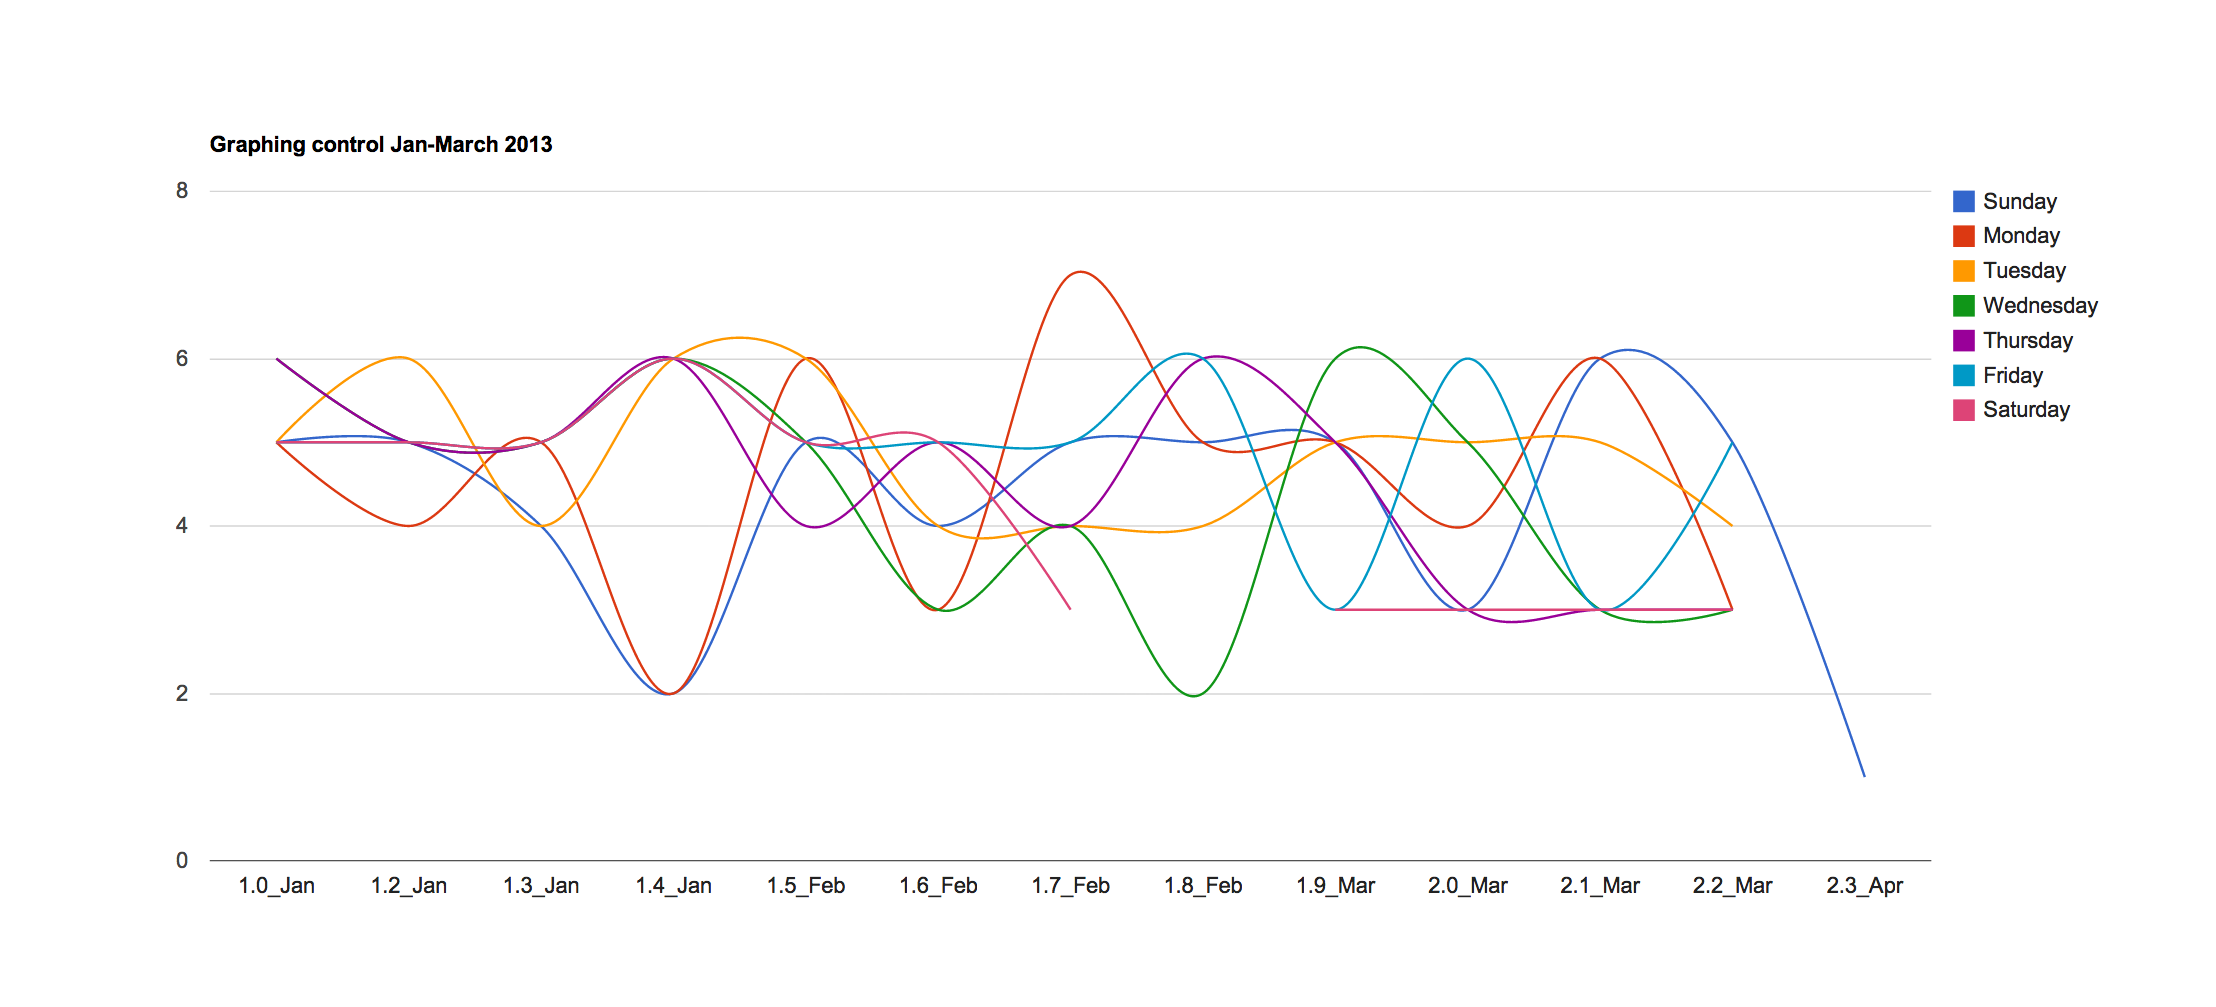
Weekly values as numbers along the bottom, values on the Y axis.
You should be able to find an interactive version of the chart here
Key:
Complete controll = 9-10
A good deal of controll = 7-8
Some controll = 5-6
A little controll= 3-4
No control at all = 1-2