For detailed description of parameters see the Data Methods part of this website
Haemoglobin: 14.1
White blood cells: 5.19
Platelets: 246
Neutrophils: 298
All in normal range.
Everything a bit uppish.
For detailed description of parameters see the Data Methods part of this website
Haemoglobin: 14.1
White blood cells: 5.19
Platelets: 246
Neutrophils: 298
All in normal range.
Everything a bit uppish.
Into the second week of March, and I’ve only just found time to write up February’s summary; which tells us something.
We had the bone marrow and bence jones tests back. Nothing in the bone marrow, no detectable paraprotein levels and no bence jones proteins. My illness only seems detectable in the damage it’s doing to my bone structure through MRI scans.
I’ve been very, very busy at work. I was advised that it was likely that I wouldn’t be able to work through this first period of treatment but I struck lucky (mostly) with the kickback from side effects. I got tired in the afternoons but and had a bit of nausea throughout the month but that’s about it. If anything I worked too hard, took too much on, increased my workload. My inner amateur psychologist suggests this was an attempt to prove to myself and colleagues that nothing is wrong, this is possibly right but I can’t say I’ve been consciously avoiding my illness. Coping mechanisms are complex things though.
Lets look at the data:
I’ve made a decision to keep cumulative graphs of my medical data but not bother with monthly. It makes sense to ascertain long-term trends with important information like this. For the affect data, I’m going to do both monthly and long term with the monthly summaries as percentages. Here we go
Affect analysis
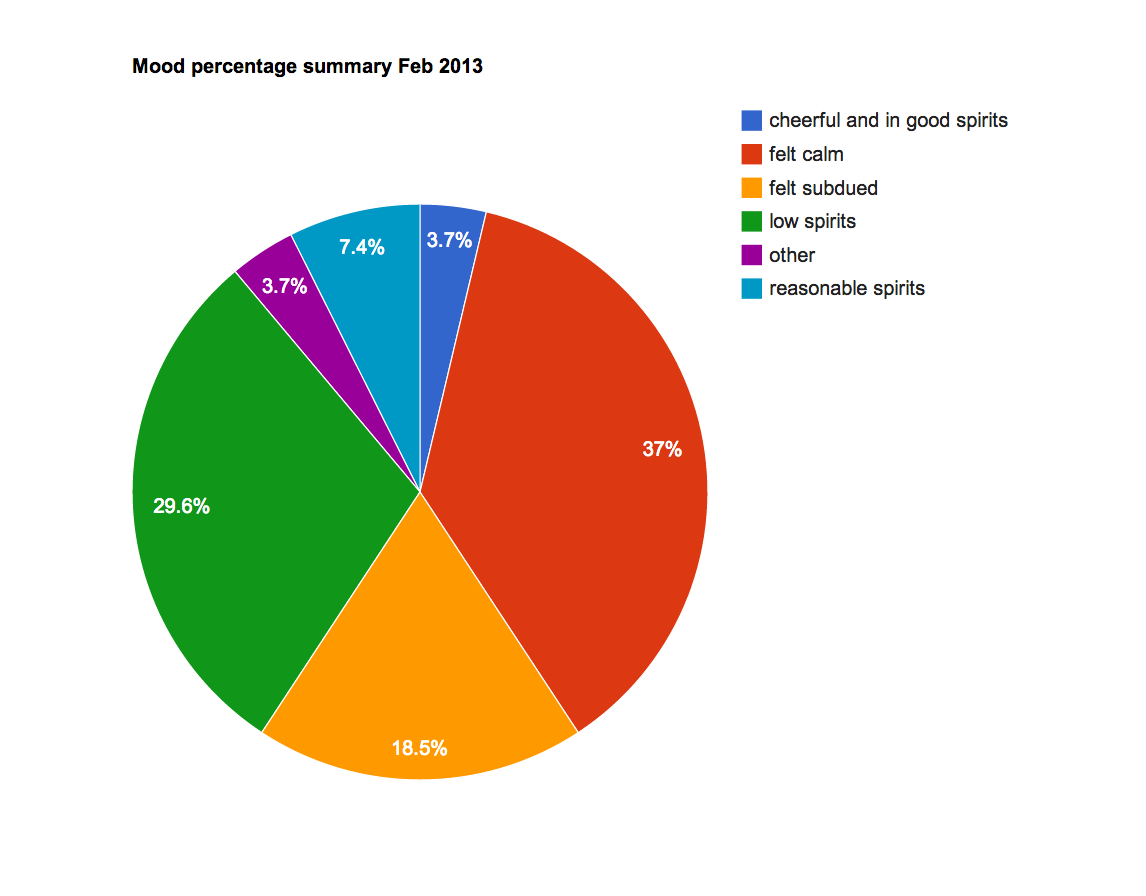
Mood (top image): highest of 8 (cheerful and in good spirits) and a low of 4 (low spirits).
Looking at the percentages the 4 (low spirits) swamps the highs this month by a whopping 29% compared to 3.7%. Most of the time, i.e. 37% I felt calm. I’m quite surprised at how often I did feel in ‘low spirits’; I was also subdued 18.5 % of the time. I thought I’d been coping better than that, but I suppose it’s not surprising when you’ve been told you’ve got incurable cancer. I also think that the amount of work I had on is telling, it takes me away from the creative activity of the type which makes me happy.
Stoicism: a high of 9 (illness what illness) and a low of 3 (wobbly lip)
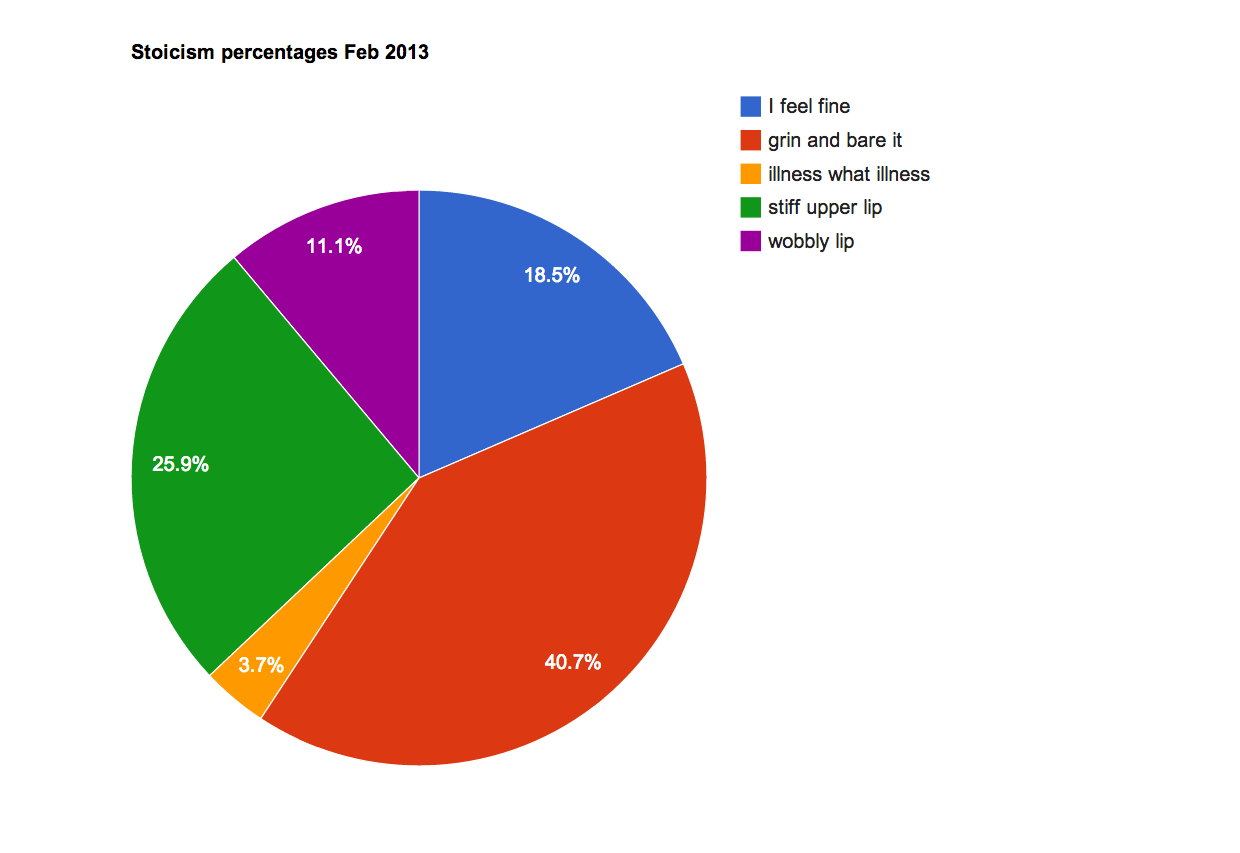
The percentages breakdown are interesting compared to mood and suggest that while my feelings about things are affected, my resilience or ability to cope is good. 40% of the time I’m happy to grin and bare it, 18.5% of the time ‘I feel fine’. 26% of the time I stiffen my lip in the grand British manner. Of course all sorts of constructions can be made about this, including that I suffer a complete inability to face my plight. I prefer to think I’m good at coping and a stubborn bugger though.
Control A high of 7-8 (a good deal of) and a low of 1- 2 (no control),\ both are outliers though with only 3.57%.
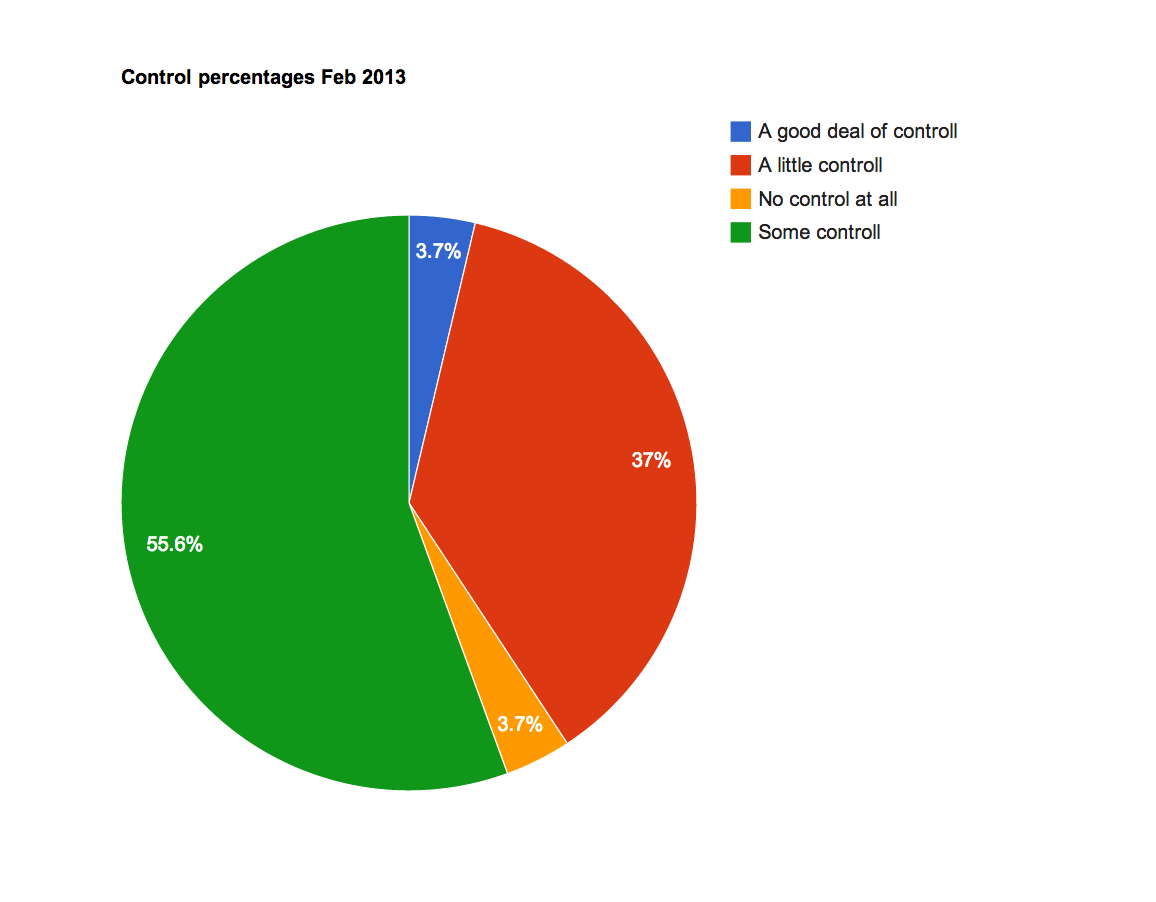
The majority of the time I felt ‘some control’ at 53.57% or at least ‘a little’ at 35.7%. These figures do seem to reflect the stoicism index and I draw similar conclusions. Dips and highs reflect times when I’m more creative, overburdened with work, or as is the case here, misinterpreted a medical analysis.
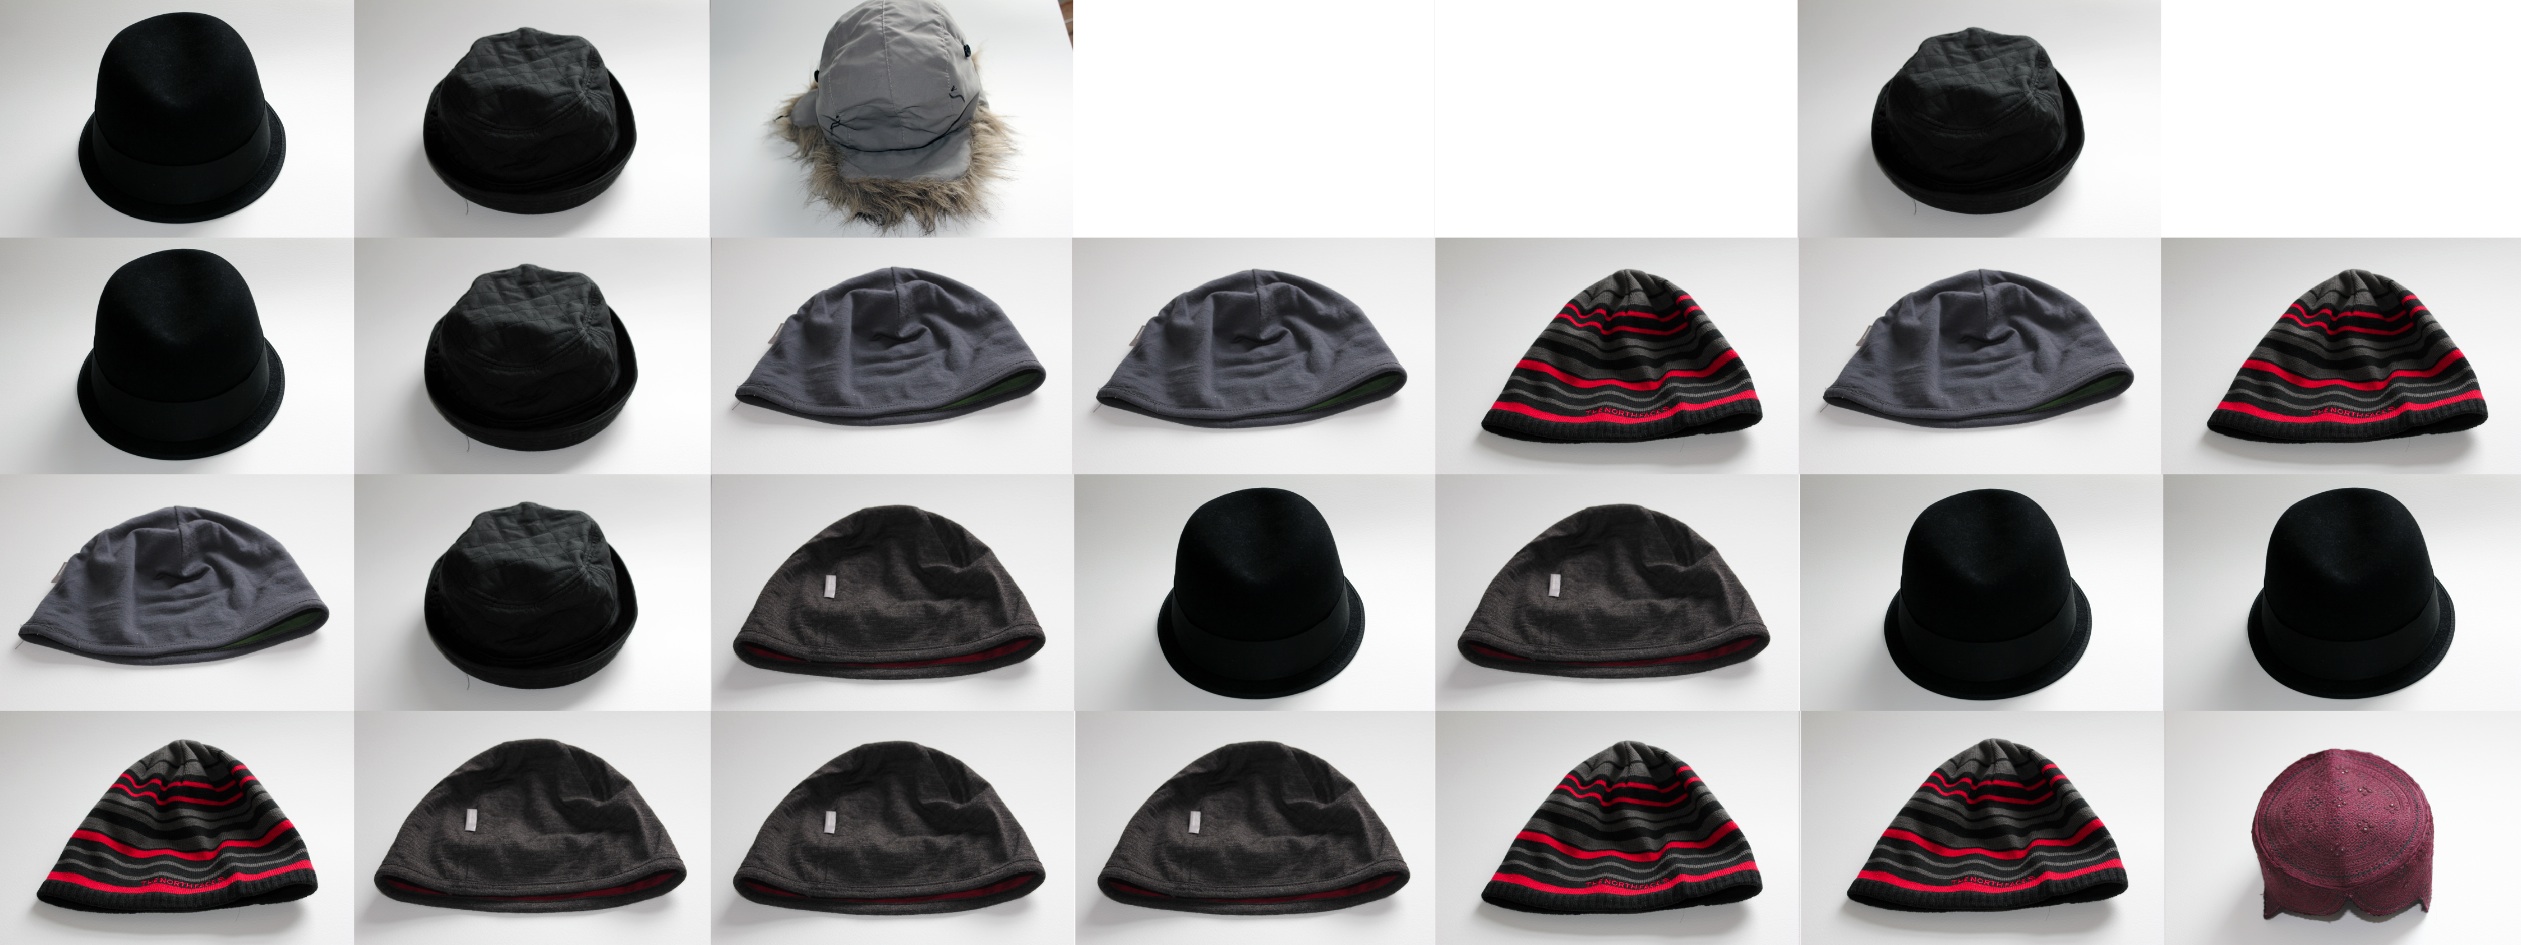
Hats
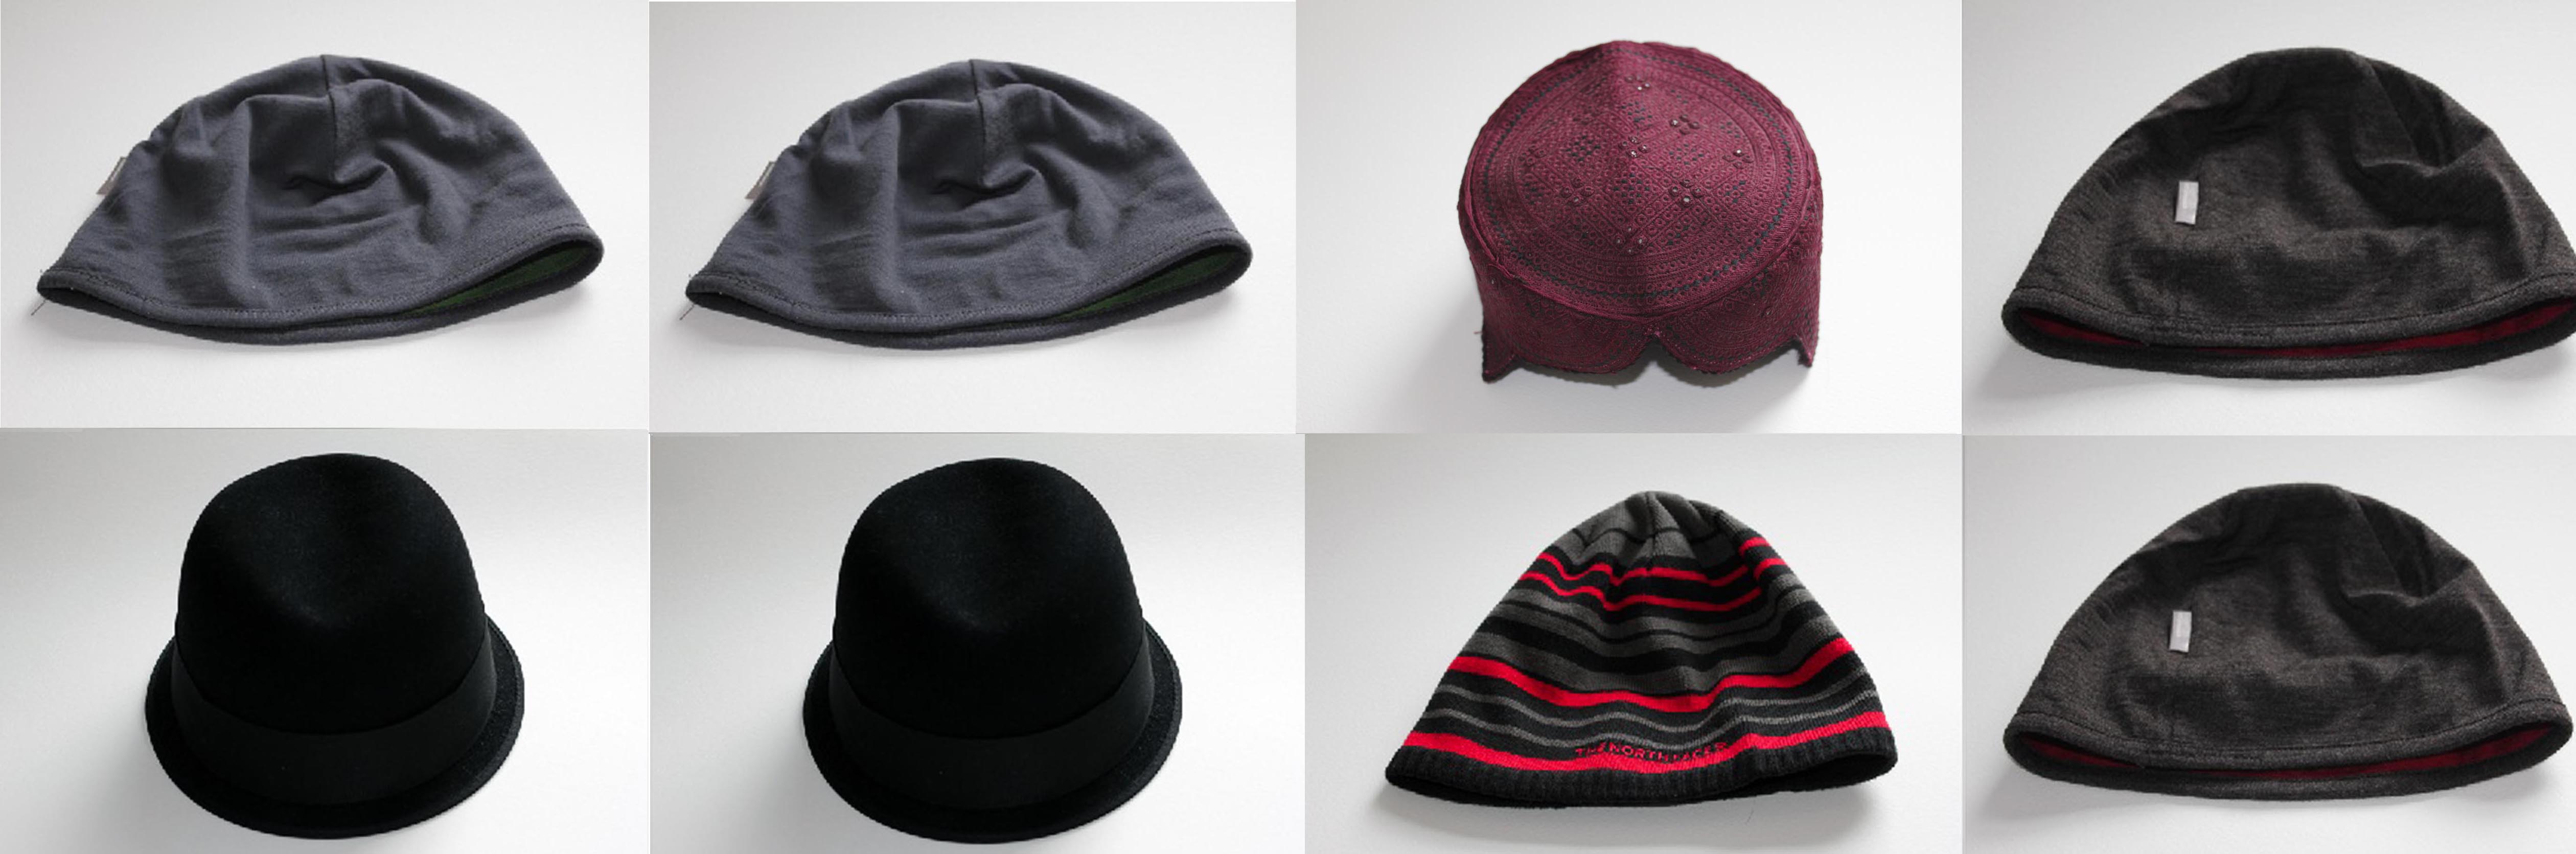
Hat analysis = remarkably well distributed.
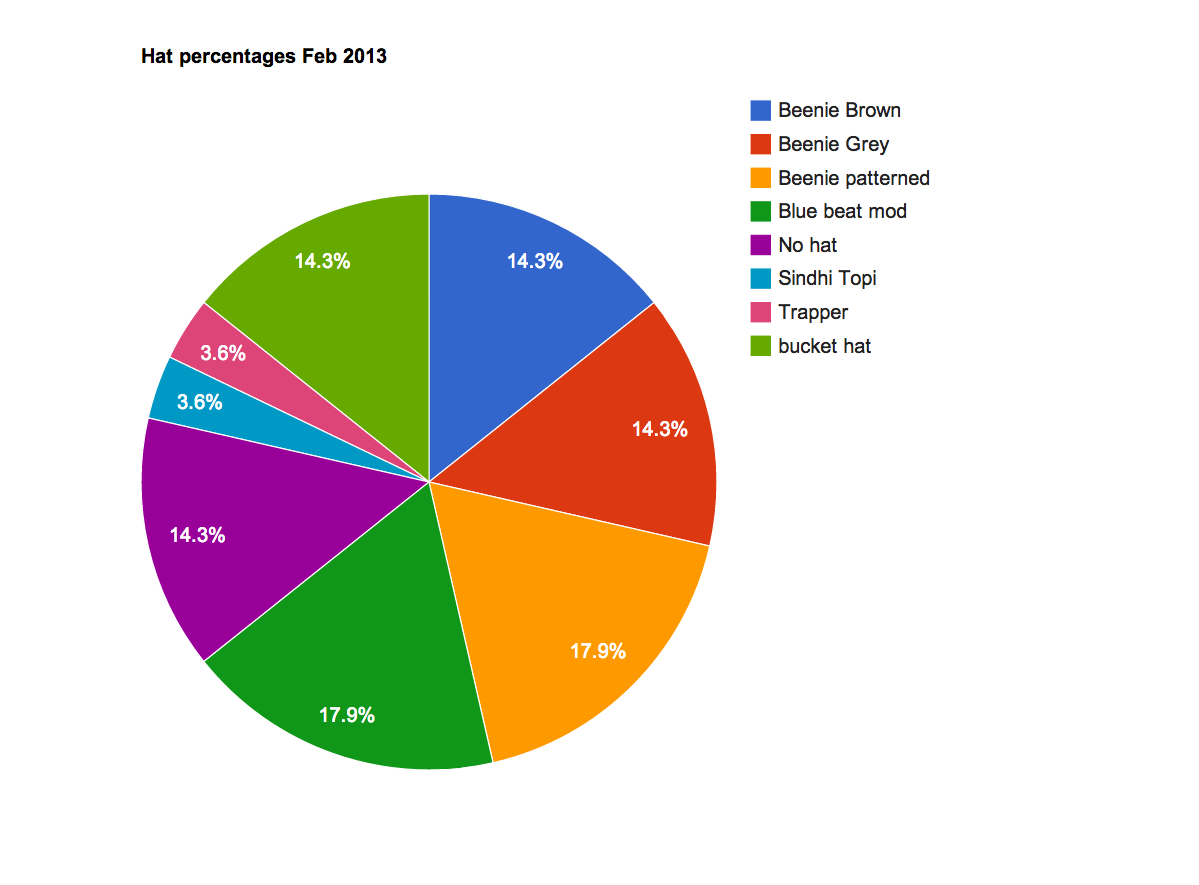 My favourite individual hat in terms of style being my Mod hat at 17.9%, followed by the bucket hat at 14.3 %. and ‘no hat’ the same. The beanie hats are cumulatively worn more than any other style, they are convenient more than anything and I wear them inside too.
What to ascertain from what I’m trademarking as the ‘pyschosartorial’ as a nod to pyschogeography? I’m surprised just how often I haven’t bothered to wear a hat at all, because my memory of this is that it was a rarer occurrence than actually the case. I’m wondering if it’s worth cross referencing the hat data to mood to see if there’s any correlation between the two in pyschosartorial terms. Something for the future. The Sindhi Topi was a recent addition so scores low on that count and is not a reflection on preference. More analysis needed here really, but something to watch out for.
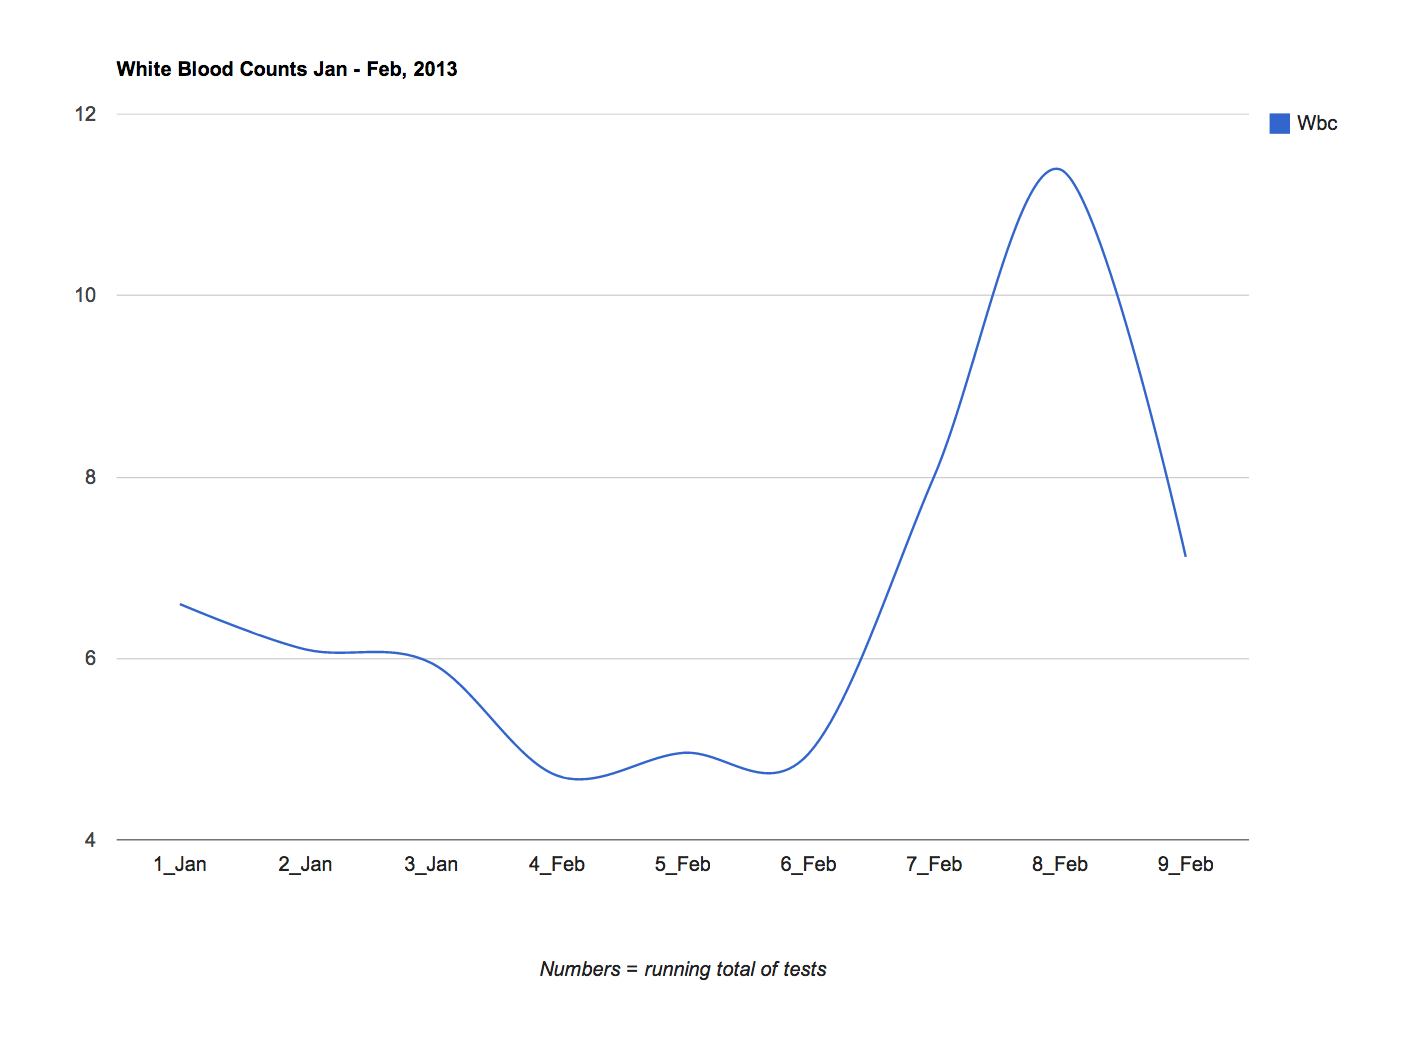
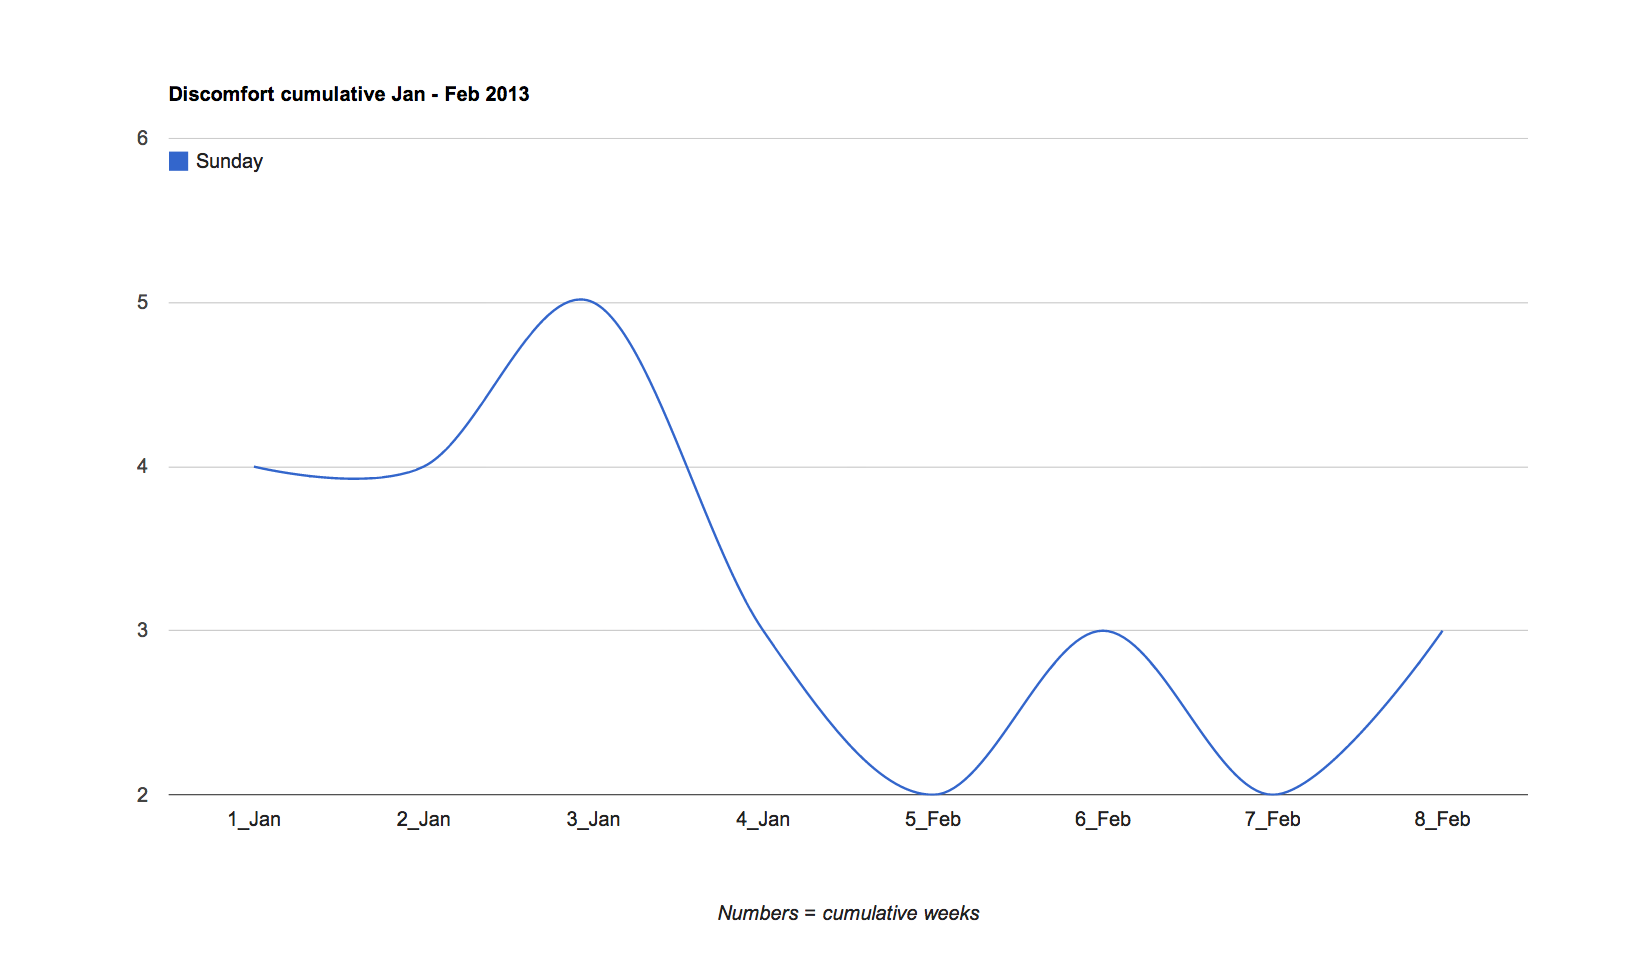
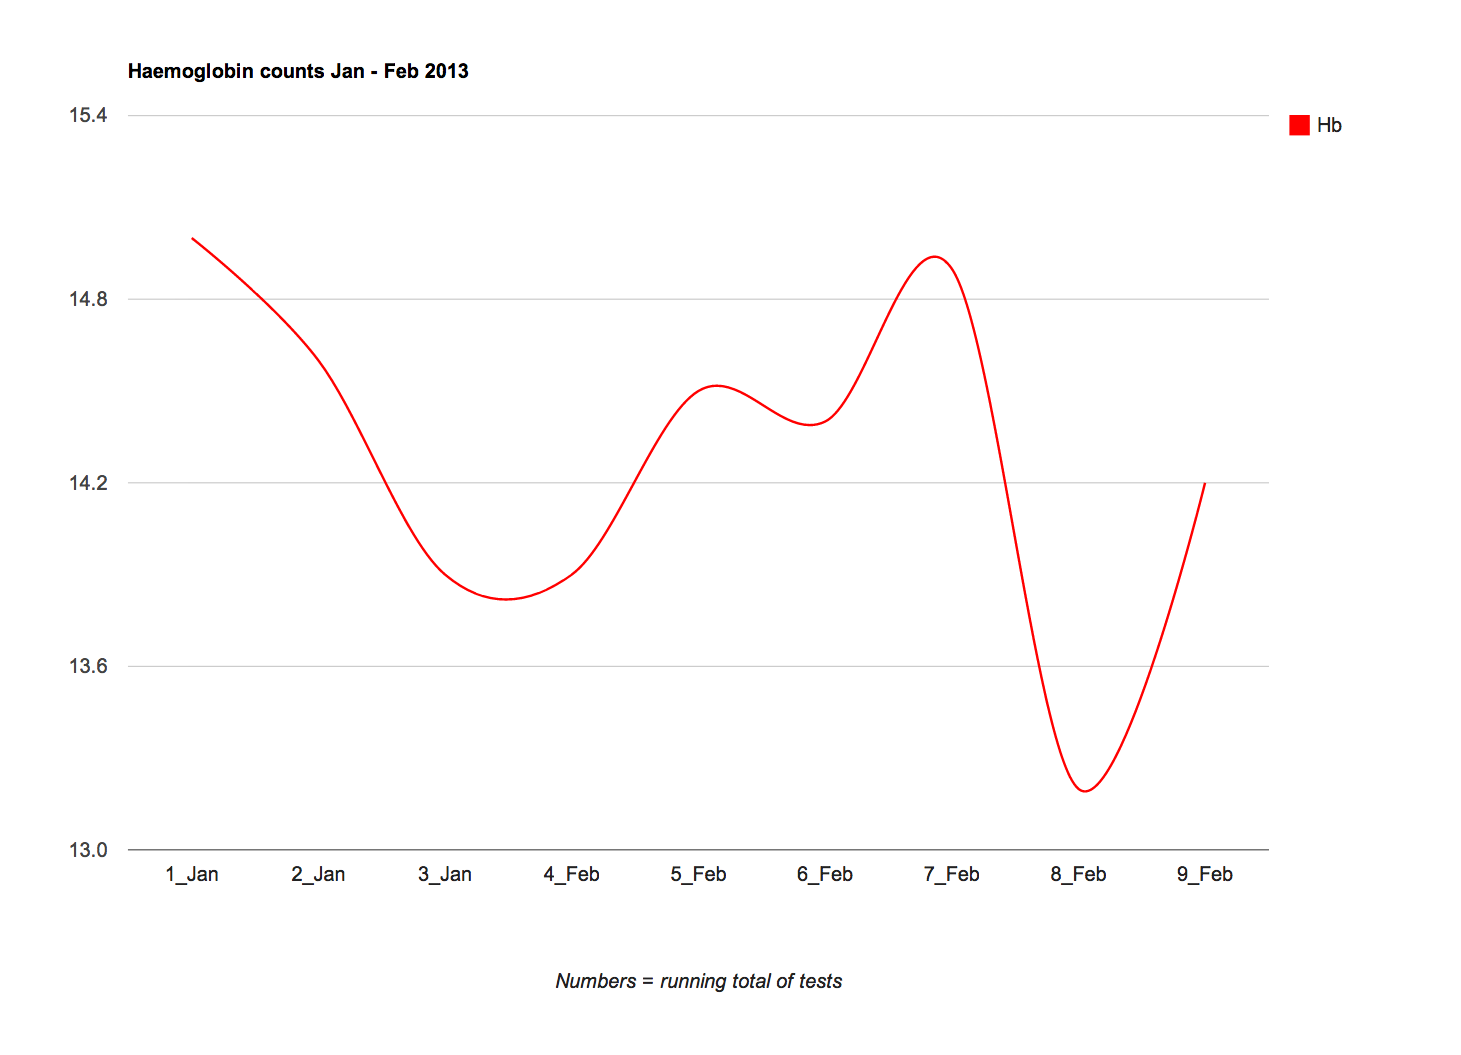
Bloods and discomfort analysis
As mentioned previously, I’m only going to track medical and physical data as a cumulative charting.
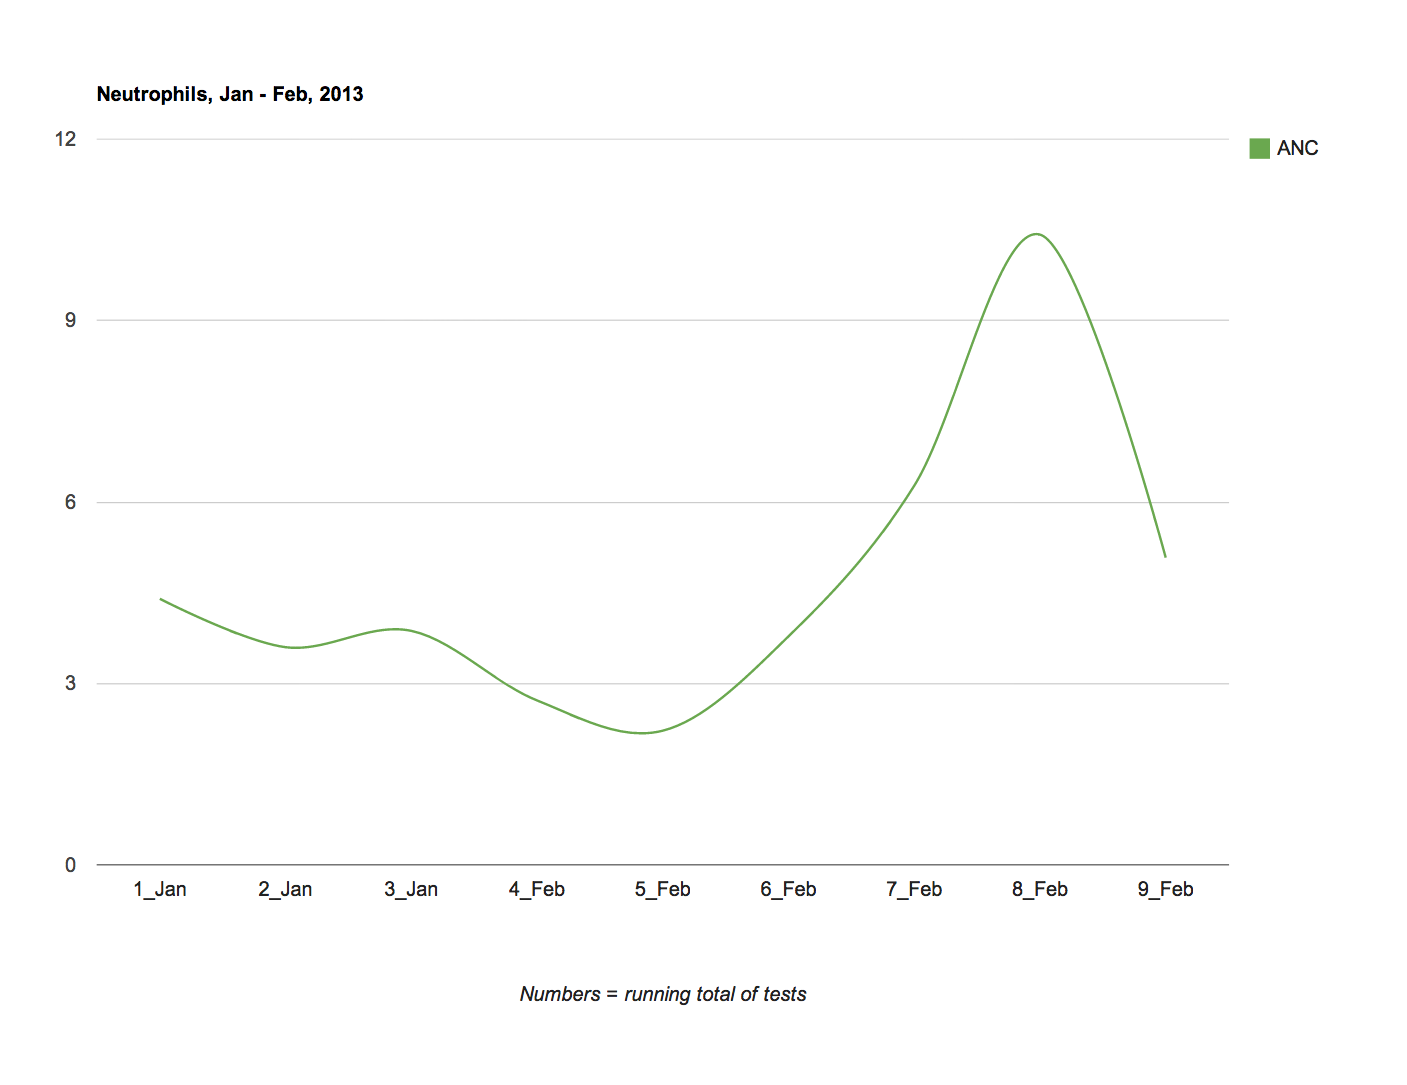
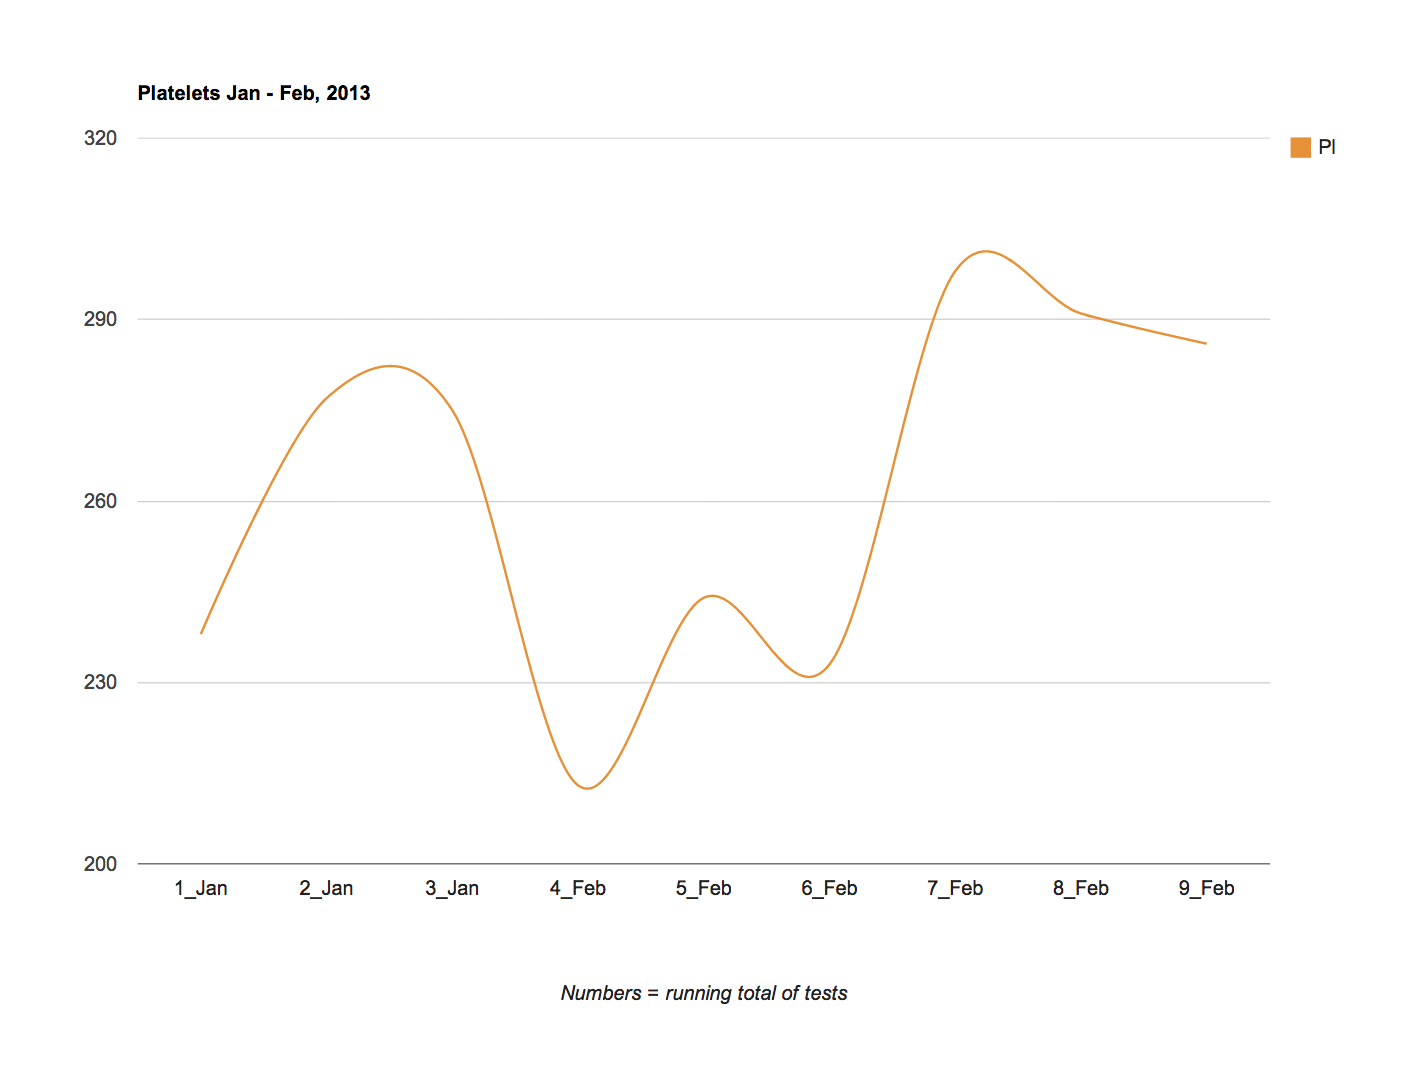
My bloods (Haemoglobin, White cell count, Neutrophils) all stayed within normal parameters, so despite the hammering the chemo was giving my immune system, it was coping quite well. The discomfort index was similarly stable mostly settling along the 2 – 3 range or mild. There was an up-kick early in the month to 5 (moderate) which coincided with a misunderstanding of a medical diagnosis which put me under enormous physical and psychological stress. Again there is future scope to merge some of this data with the affect information at some point.
For detailed description of parameters see the Data Methods part of this website
Haemoglobin: 13.7
White blood cells: 5.36
Platelets: 208
Neutrophils: 3.27
All in normal range.
Everything a bit downish though.
For detailed description of parameters see the Data Methods part of this website
Haemoglobin: 14.2
White blood cells: 7.12
Platelets: 286
Neutrophils: 05.08
All in normal range.
Neuts and platelets all down a bit
week ending Feb 24th 2013
A busy week work-wise, and I mean work-wise not in terms of the blog where I was hoping to put more time into exploring how the data translates into watercolour structures and material. My working week has managed to continue reasonably uninterrupted to date despite a heavy demand on my time From the hospital. I’ve got used to being largely hairless but feel physically able. Mostly.
My treatment involves bursts of a full week of chemo followed by weekly squirts. I’ve just had a full week of a heavy dose of daily steroids (dex) which I’ve just come off. The emotional and physical side effects from this are quite tough to take and will reflect in the data I’m sure.
Data Summary
Hats: (Beenie grey x 2, Sindhi x1, Blue beat Mod x 2, Patterned beenie x 1)
Stoicism: a low of 3 wobbly lip and a high of 9 illness what illness. Mostly 5 stiff upper lip. I think the lower stats here are dex induced but I do find I can cope better when I’m doing creative activities as represented by illness what illness.
Mood: a low of 4 (subdued) and a high of 7 (cheerful and in good spirits), mostly 6 (calm). Interestingly the high and low scores don’t map to the stoicism scores. Some further analysis on this to come.
Control: a low of 4 (little control) and a high of 5 mostly 5 (some control ), looks fairly steady, I was juggling multiple work demands so reflected in this data.
Discomfort: a low of 2 (mild) and a high of 5 (moderate). Mostly 2(mild), I think the low discomfort scores are looking good here. My back has really settled down and not feeling much of anything anymore.
Medical
Bloods (Haemoglobin, White cell count, Platelets, Neutrophiils) all stayed stable and in the normal range. My specialists calls this boring, I’m delighted.
For detailed description of parameters see the Data Methods part of this website
Haemoglobin: 13.2
White blood cells: 11.39
Platelets: 291
Neutrophils: 10.42
All in normal range.
Neuts and up which is good.
For detailed description of parameters see the Data Methods part of this website
Haemoglobin: 14.9
White blood cells: 8.01
Platelets: 298
Neutrophils: 6.27
All in normal range.
Neuts and all other results up which is good.