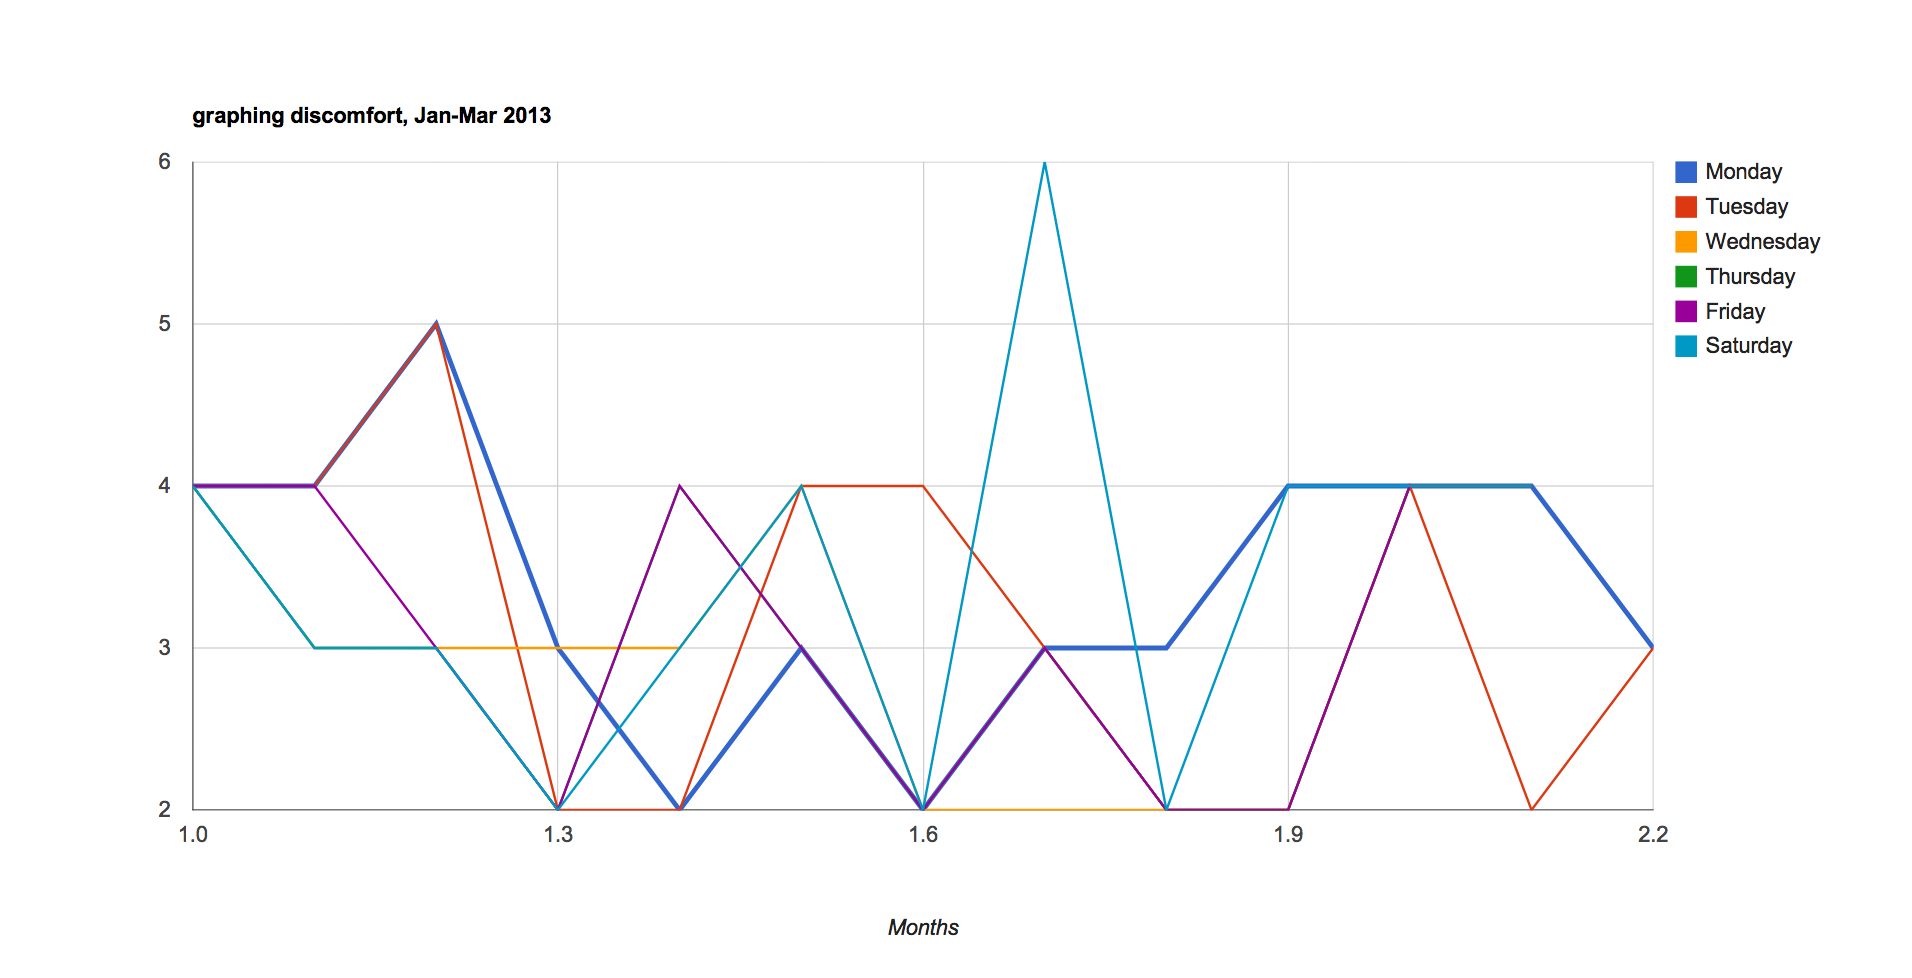
Weekly values as numbers along the bottom, values on the Y axis.
You should be able to find an interactive version of the chart here
Key:
0= none,
2= mild,
4 = moderate,
8= severe,
10 = worst possible
Weekly values as numbers along the bottom, values on the Y axis.
You should be able to find an interactive version of the chart here
Key:
0= none,
2= mild,
4 = moderate,
8= severe,
10 = worst possible
blood and bones. RSS feed. Blog at WordPress.com.
